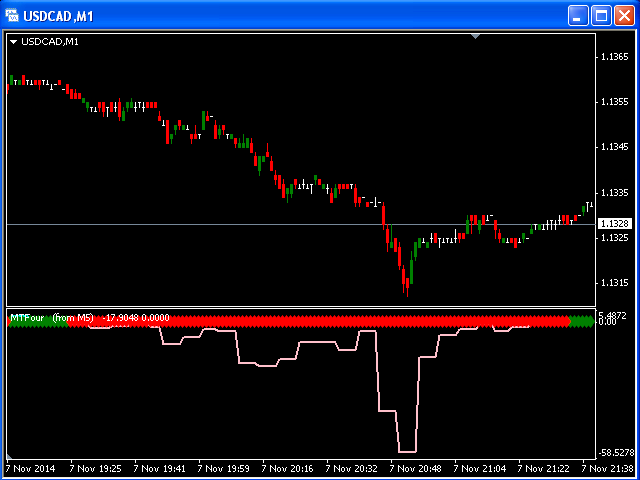
Higher TF CCI stepper MT4
- Indikatoren
- Version: 1.8
- Aktualisiert: 24 April 2020
- Aktivierungen: 5

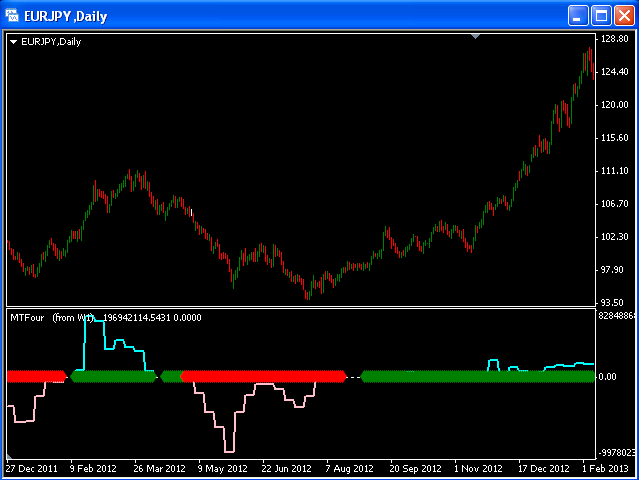
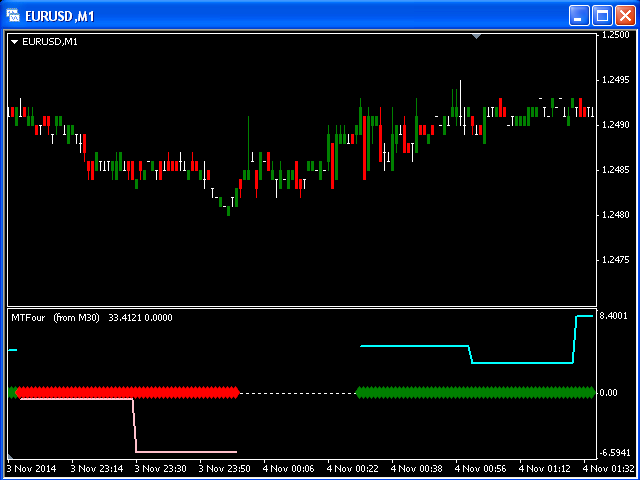
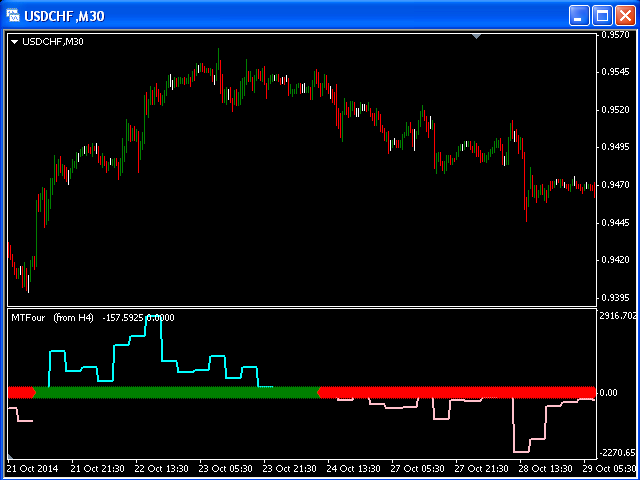
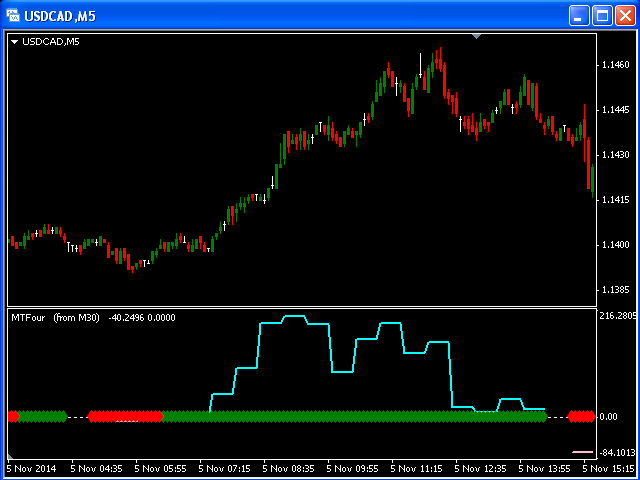
Dieser Multi-Timeframe-Indikator basiert auf der Idee des klassischen Indikators CCI (Commodity Channel Index). Wie Sie wissen, wurde der CCI entwickelt, um überkaufte und überverkaufte Niveaus zu bestimmen. Dazu misst der CCI das Verhältnis zwischen dem Preis und einem gleitenden Durchschnitt (MA), oder genauer gesagt, die normalen Abweichungen von diesem Durchschnitt.
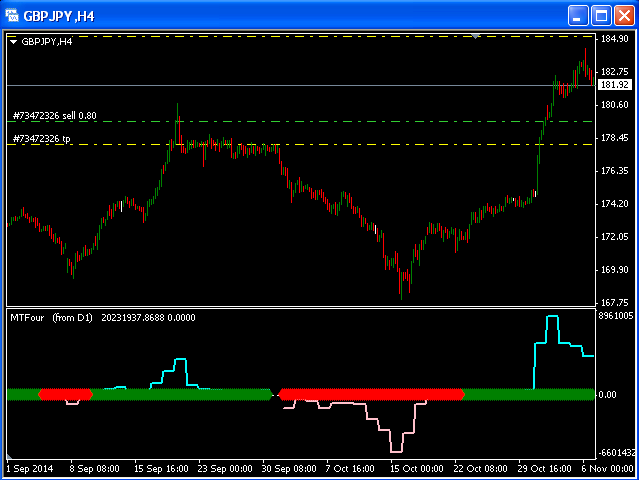
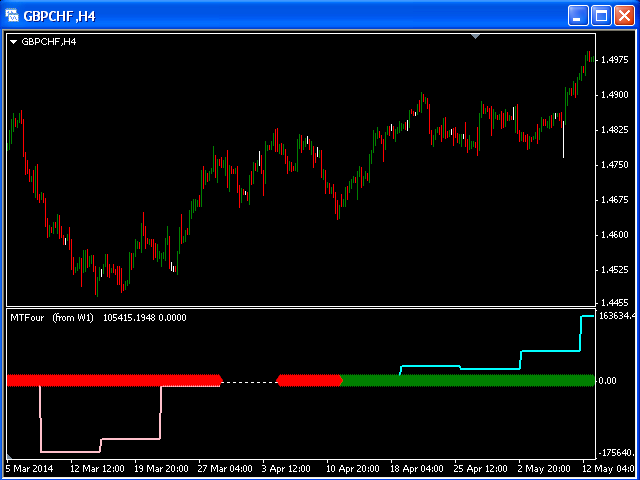
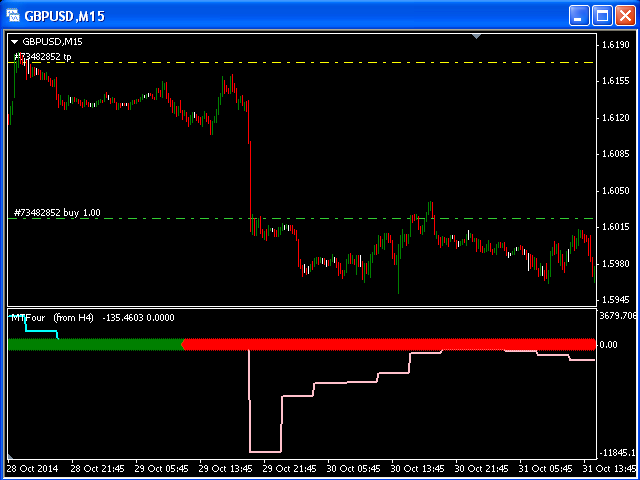
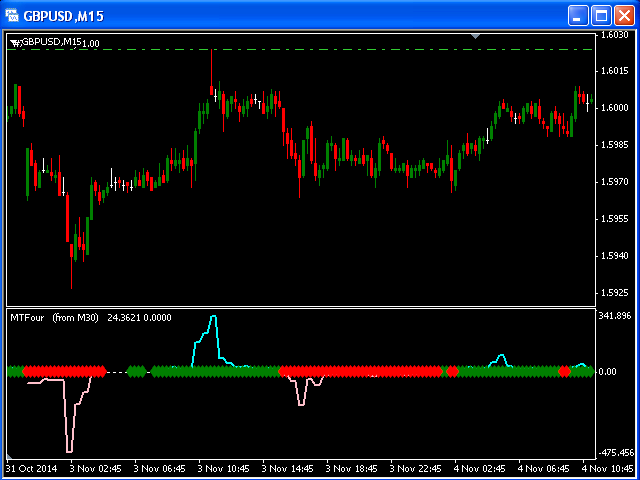
Dieser spezielle Indikator zeigt die modifizierten CCI-Daten eines höheren Zeitrahmens, geordnet nach dem Eingabeparameter "TF". Grüne Rauten auf dem Diagramm stehen für einen Aufwärtstrend und rote Rauten für einen Abwärtstrend.