Higher TF CCI stepper MT4
- Indicadores
- Versión: 1.8
- Actualizado: 24 abril 2020
- Activaciones: 5

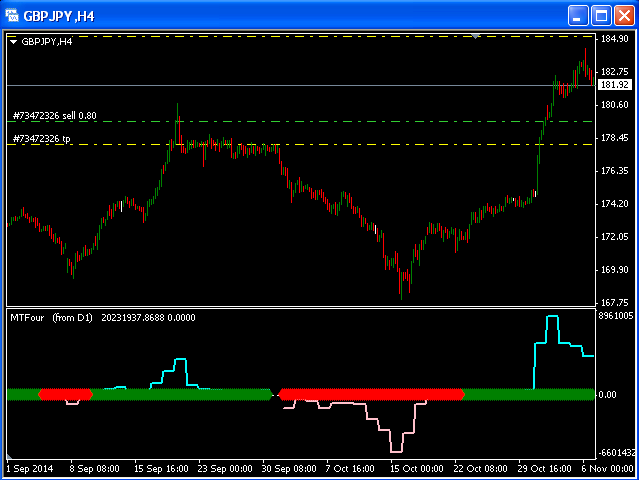
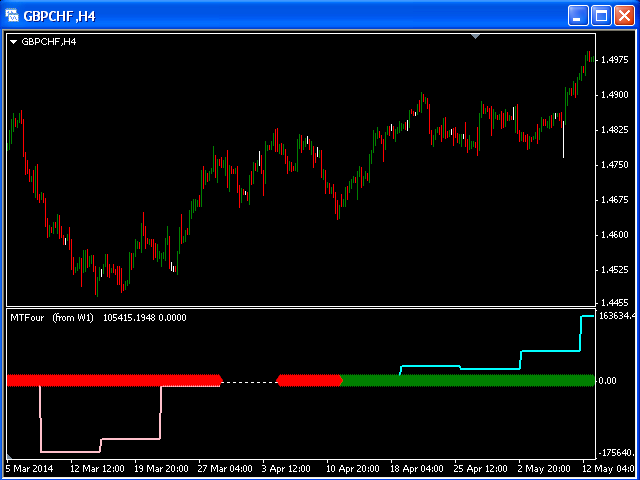
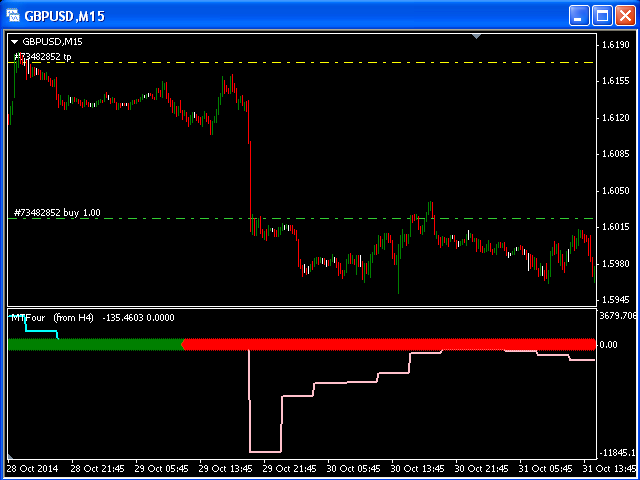
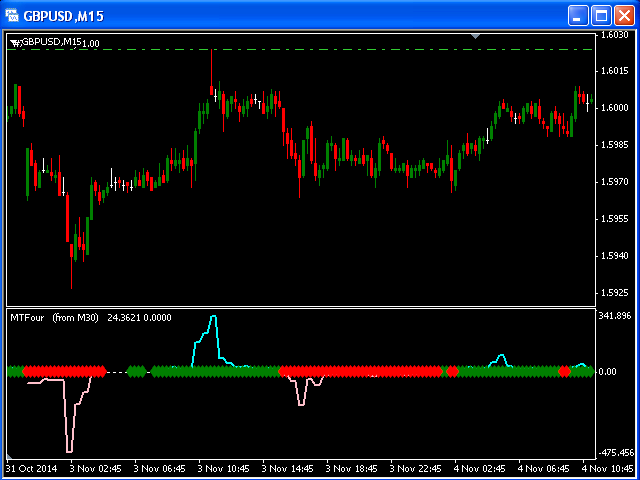
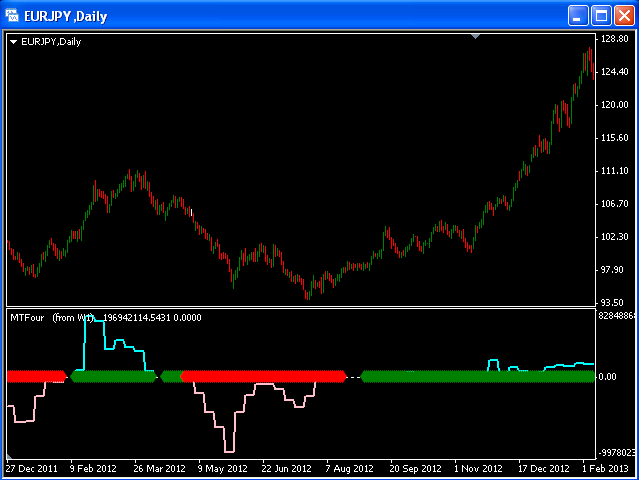
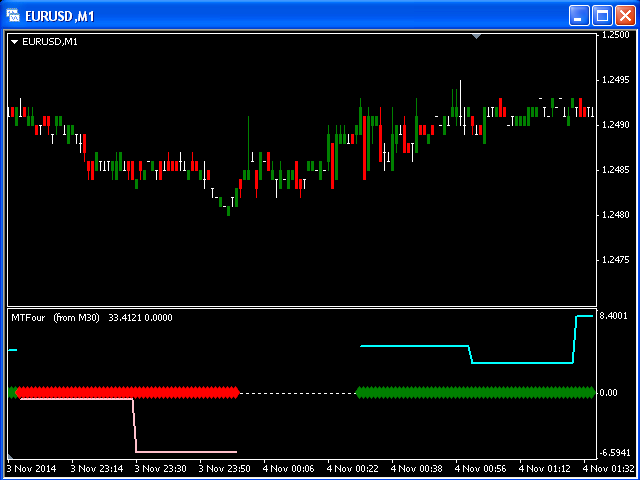
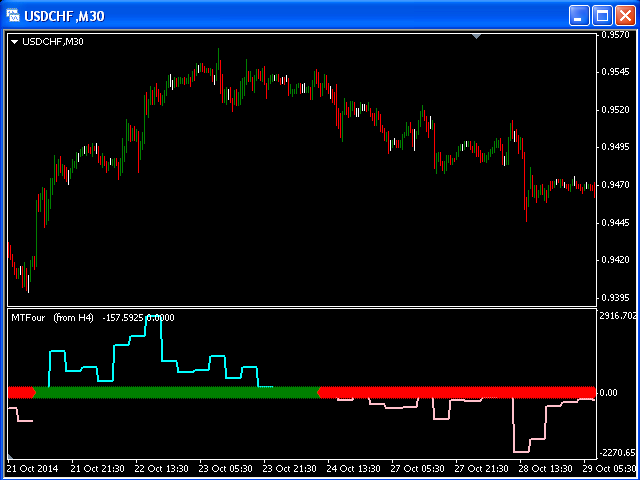
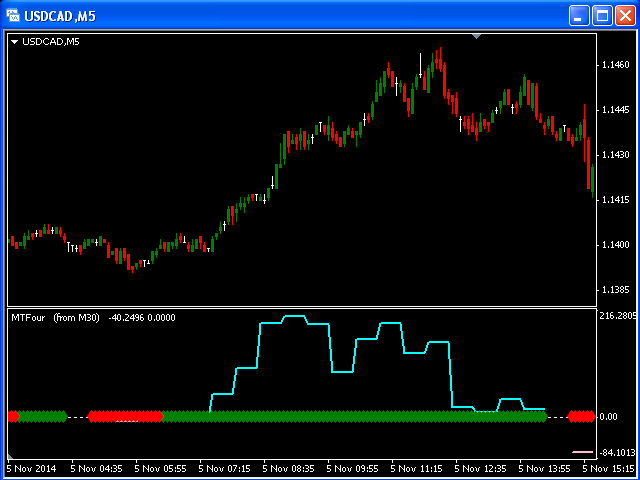
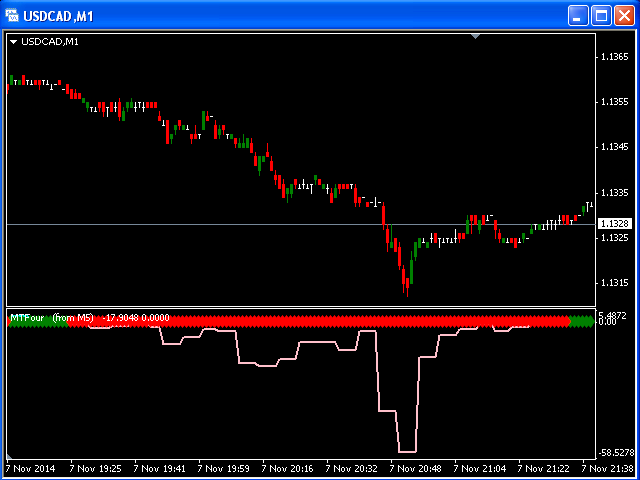
Este indicador multi-marco de tiempo se basa en la idea del indicador clásico CCI (Commodity Channel Index). Como sabe, el CCI se desarrolló para determinar los niveles de sobrecompra y sobreventa. El CCI lo hace midiendo la relación entre el precio y una media móvil (MA) o, más concretamente, las desviaciones normales de dicha media.
Este indicador en particular muestra los datos modificados del CCI de un marco temporal superior ordenados por un parámetro de entrada "TF". Los rombos verdes del gráfico representan una tendencia alcista y los rojos una tendencia bajista.