TheStrat Levels MT5
- Indikatoren
-
Robert Gerald Wood
 Professioneller Softwareentwickler mit über 25 Jahren Erfahrung, der jetzt Tools für mich selbst erstellt und sie der breiteren Community zur Verfügung stellt.
 - Version: 2.10
- Aktualisiert: 18 Juni 2021
- Aktivierungen: 10
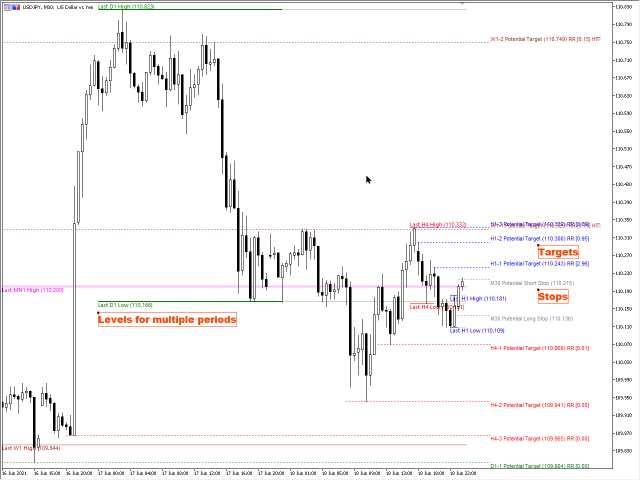
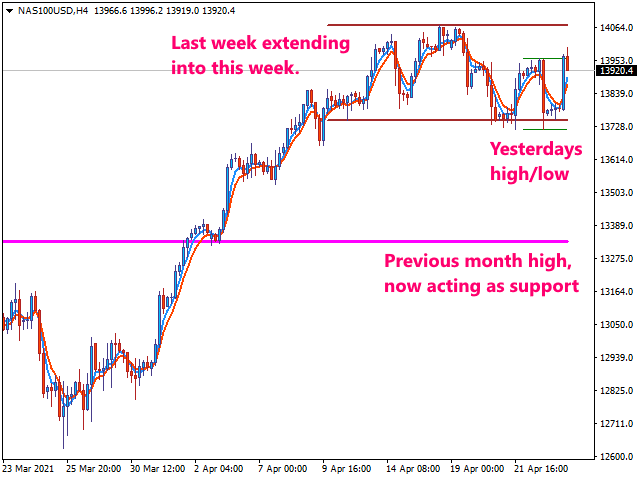
Dieser Indikator zeichnet die vorherigen Höchst- und Tiefstwerte für mehrere Zeitrahmen und kann potenzielle Take-Profit- und Stop-Loss-Niveaus anzeigen.
Im Sinne von Rob Smiths #TheStrat sind dies potenzielle Einstiegspunkte oder alternativ potenzielle Ziele für offene Positionen. Ich verwende sie gerne auf beide Arten. Auf einem niedrigeren Zeitrahmen, z. B. 5 Minuten, um einen guten Einstieg auf Tages- oder Wochenebene zu erhalten, und dann als potenzielles Ziel. Es sind sehr kleine Stopps erforderlich, die ein hervorragendes Risiko-Ertrags-Verhältnis bieten.
Wichtigste Merkmale
- Levels von stündlichen, vierstündlichen, täglichen, wöchentlichen und monatlichen Zeitrahmen- Potenzielle Take-Profit-Levels
- Potenzielle Stop-Loss-Levels basierend auf dem aktuellen oder einem höheren Zeitrahmen
- Kontinuierliche Berechnung von Risiko und Gewinn für jedes potenzielle Zielniveau auf der Grundlage des potenziellen Stop-Levels
- Identifizierung des Pivot-Maschinengewehrs
- Beschriftung für jedes Niveau, damit Sie erkennen können, worum es sich handelt
- Umfassende Optionen, um es nach Ihren Wünschen zu gestalten
Bitte sehen Sie sich das DEMO-Video für weitere Details an, da die Bilder dem Indikator nicht gerecht werden.
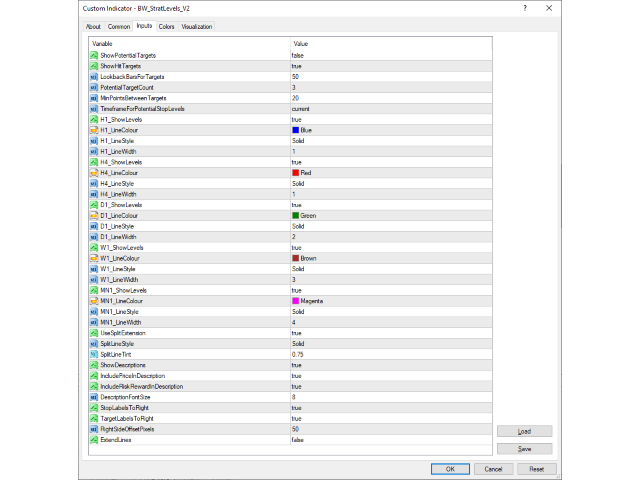
Einstellungen
Es gibt eine Reihe von Einstellungen, die für jeden Zeitrahmen wiederholt werden.
ShowLevels
Bei "true" werden die Levels für diesen Zeitrahmen gezeichnet. Die Linien werden vom Beginn der letzten Periode bis zum aktuellen Zeitpunkt gezeichnet. Sobald ein neuer Zeitraum beginnt, werden die Linien zu den neuen Niveaus neu gezeichnet.
LinieFarbe
Sie können die Linienfarbe auf einen beliebigen Wert aus der Standardfarbauswahl einstellen.
Linienstil
Der Linienstil kann zwischen einer einfachen durchgezogenen Linie, Punkten, Strichen oder Punkten und Strichen variieren.
Linienstärke
Wenn die Linienart durchgezogen ist, kann die Linienbreite einen beliebigen Wert aus der verfügbaren Auswahl (1 bis 5) annehmen.
UseSplitExtension
Wenn diese Option auf True gesetzt ist, werden die gezeichneten Linien in den historischen Teil, der mit den oben genannten Linienstilen, -breiten und -farben gezeichnet wird, und den projizierten Teil, der einen modifizierten Stil auf der Grundlage der folgenden Einstellungen verwendet, aufgeteilt.
SplitLineStyle
Wenn Sie möchten, können Sie den Linienstil so einstellen, dass er sich deutlich sichtbar vom historischen Teil der Linie unterscheidet. Wenn Sie ihn auf STYLE_SOLID setzen, behält die projizierte Linie die oben eingestellte Breite bei.
SplitLineTint
Sie können die Farbe der projizierten Linie ändern, indem Sie ihr eine Tönung geben. Das ist eine Verringerung der Intensität der Hauptfarbe, die für die oben eingestellte historische Linie ausgewählt wurde. Der Standardwert ist hier 0,5, was eine Halbierung der Farbintensität bedeutet.
Stopp- und Zielwerte
ShowPotentialTargets
Wenn dies der Fall ist, werden potenzielle Zielebenen für jeden Zeitrahmen angezeigt, der mit den ShowLevels-Einstellungen aktiviert wurde.
ShowHitTargets
Wenn diese Option auf "true" gesetzt ist, bleibt ein erreichtes Zielniveau so lange im Diagramm angezeigt, bis der Zeitrahmen abgelaufen ist. Andernfalls werden die potenziellen Zielebenen entfernt, sobald sie erreicht wurden.
LookbackBarsForTargets
Legt fest, wie weit zurück in der Historie das System nach Zielniveaus suchen soll. Die Voreinstellung ist 50 Takte.
PotenzielleZieleZahl
Hier können Sie festlegen, wie viele potenzielle Zielebenen Sie pro Zeitrahmen sehen möchten. Die Voreinstellung ist 3.
MinPointsBetweenTargets
Wenn die Ziele zu nahe beieinander liegen, ist das nicht sehr hilfreich. Mit dieser Einstellung können Sie festlegen, wie viele Punkte zwischen einem Ziel und dem nächsten liegen sollen. Wird pro Zeitrahmen berechnet.
TimeframeForPotentialStopLevels
Ermöglicht Ihnen die Auswahl des Zeitrahmens, aus dem die Stop-Loss-Levels berechnet werden sollen. Standardmäßig wird der aktuelle Zeitrahmen verwendet, was einen sehr engen Stop Loss ergibt.
Beschreibende Etiketten
ShowDescriptions
Wenn diese Option auf "true" gesetzt ist, werden für jede angezeigte Ebene beschreibende Etiketten gezeichnet.
IncludePriceInDescription
Wenn diese Option auf "true" gesetzt wird, wird der Preis der Stufe in die Beschreibung aufgenommen.
IncludeRiskRewardInDescription
Bei true wird der Risiko-/Belohnungswert in die Beschreibung aufgenommen.
DescriptionFontSize
Wählen Sie, wie groß die Beschriftungen sein sollen.
StopLabelsToRight
Bei "true" werden die Beschriftungen für Haltestellenebenen rechts von der Haltestellenebene gezeichnet. Bei false wird die Beschreibung links von der Stufe gezeichnet.
TargetLabelsToRight
Wenn diese Option auf true gesetzt ist, werden die Beschriftungen für die Zielebenen rechts von der Stoppebene gezeichnet. Bei false wird die Beschreibung links von der Stufe gezeichnet.
RightSideOffsetPixels
Hier können Sie festlegen, wie weit von der aktuellen Zeit entfernt die Beschriftungen für Stopp und Ziel gezeichnet werden sollen. Nur relevant, wenn Sie StopLabelsToRight oder TargetLabelsToRight verwenden.
ExtendLines
Standardmäßig ist diese Option falsch. Bei True werden die Linien auf der rechten Seite des Diagramms erweitert.
This greatly helps with being more mechanical with my trading