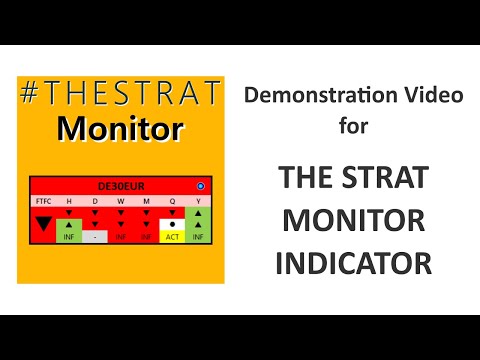
TheStrat Monitor
- Indikatoren
-
Robert Gerald Wood
 Professioneller Softwareentwickler mit über 25 Jahren Erfahrung, der jetzt Tools für mich selbst erstellt und sie der breiteren Community zur Verfügung stellt.
 - Version: 1.21
- Aktualisiert: 22 Oktober 2021
- Aktivierungen: 10
Wenn Sie sich noch nicht mit der Handelsstrategie The Strat vertraut gemacht haben, sollten Sie sie jetzt googeln. Ich verspreche Ihnen, dass es keine Zeitverschwendung sein wird und dass Sie wahrscheinlich einige neue Tricks lernen werden, ob Sie ihn nun verwenden oder nicht.
OK, jetzt wissen Sie also, was TheStrat ist, und Sie werden verstehen, was dieser Indikator für Sie tun kann.
Hauptmerkmale
Kurz gesagt, der Indikator wird:
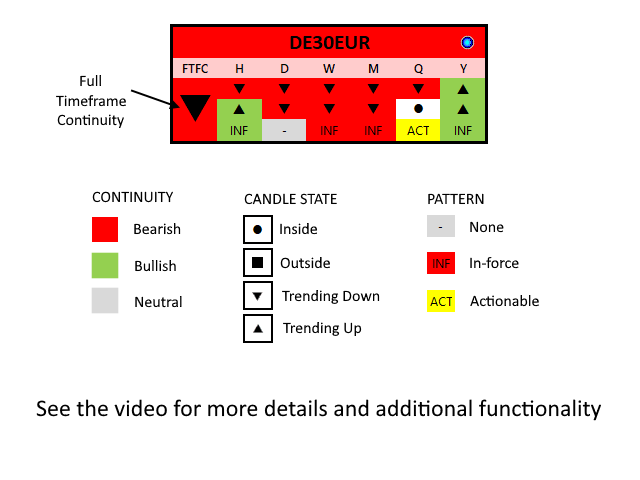
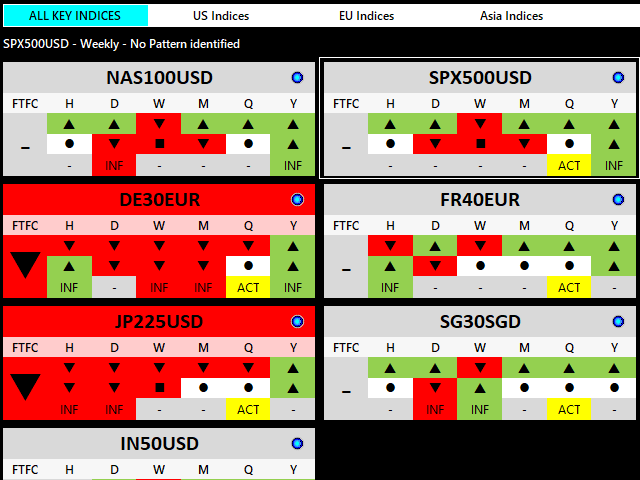
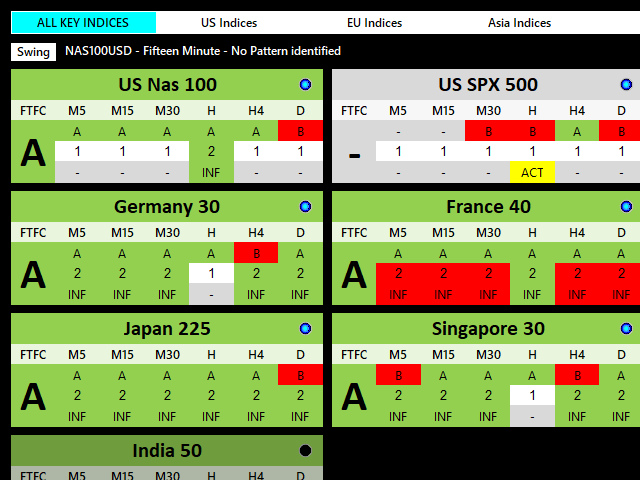
- Zeigt Timeframe Continuity für alle unterstützten Timeframes
- Unterstützt zwei Timeframe-Ansichten, Daytrader und Swingtrader
- Zeigt an, wenn Full Timeframe Continuity für beliebige 4 aufeinanderfolgende Zeitrahmen vorliegt
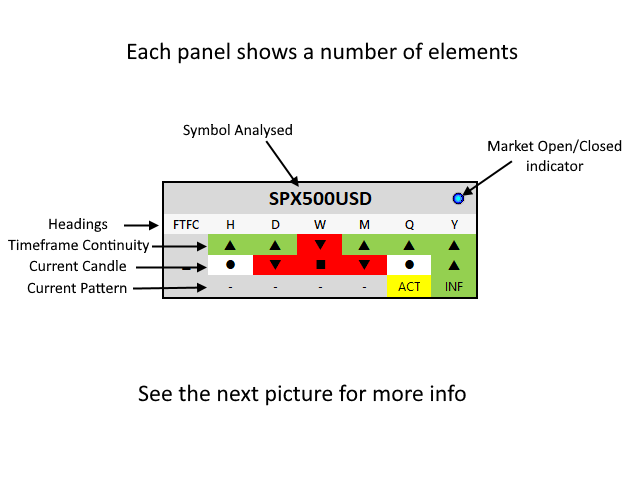
- Anzeige des aktuellen Kerzenstatus für jeden Zeitrahmen
- Zeigt das aktuelle Muster, falls vorhanden, für alle Zeitrahmen an
- Zeigt sowohl In-Force- als auch Actionable-Muster an
- Aktualisierung alle 5 Sekunden (konfigurierbar ab 1 Sekunde)
- Ermöglicht es Ihnen, auf das Panel zu klicken, um ein Diagramm für das ausgewählte Symbol und den Zeitrahmen zu öffnen.
- Sie können wählen, welche Chartvorlage zum Öffnen von Charts verwendet werden soll
- Sie können wählen, welche Gruppen und Symbole in diesen Gruppen angezeigt werden sollen
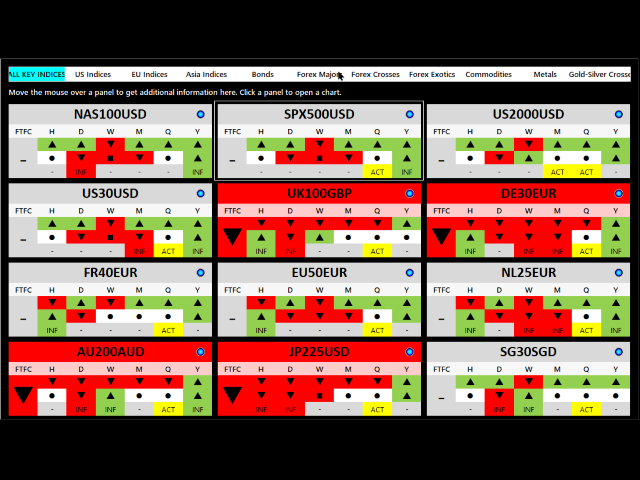
Der Indikator zeigt eine Momentaufnahme aller wichtigen Strat-Elemente, der Kontinuität des Zeitrahmens, der aktuellen Muster und der aktuellen Kerzenzustände für jedes von Ihrem Broker unterstützte Symbol an. Er tut dies für alle unterstützten Zeitrahmen, so dass Sie genau sehen können, was im Moment auf dem Markt passiert.
Sie können die Symbole nach Belieben gruppieren und den Titel der Schaltflächen für die einzelnen Gruppen auswählen. Wenn Sie alle Symbole eines bestimmten Typs gleichzeitig auf dem Bildschirm haben, können Sie Ähnlichkeiten innerhalb der Gruppe erkennen, was Ihre Analyse erleichtert.
Weitere Informationen über die Konfigurationsdatei finden Sie hier: https: //www.mql5.com/en/blogs/post/746142
Wenn ein Symbol derzeit nicht handelbar ist, der Markt geschlossen ist, der Broker deaktiviert ist usw., zeigt das Symbol-Panel die letzten verfügbaren Daten an, aber die Anzeige ist grau. Ein kleines LED-Licht-Symbol zeigt dies ebenfalls an.
EINSTELLUNGEN
SymbolNameDisplayMode
Wählen Sie zwischen Name, Beschreibung oder Beides für die Beschriftung der einzelnen Symbolfelder.
Zeitleiste
Legt die standardmäßige Timeset-Ansicht für den Indikator fest. Wählen Sie zwischen Day Trader und Swing Trader. Sie können diese Einstellung jederzeit ändern, indem Sie auf die Schaltfläche auf dem Bildschirm klicken.
Die Day Trader-Ansicht zeigt die Zeitrahmen M5, M15, M30, H1, H4 und D1 auf jedem Feld an, während die Swing Trader-Ansicht H1, D1, W1, MN1, Q und Y anzeigt.
ShowStratIcons
Wenn diese Option aktiviert ist, werden in den Panels Symbole für die Kontinuitätsrichtung, den aktuellen Kerzenstatus, die Muster und die gesamte FTFC angezeigt.
HideNeutralSymbols
Wenn diese Option aktiviert ist, werden alle Symbole, die keine FTFC-Richtung haben, ausgeblendet.
DisplayColumns
Wie viele Spalten des Panels möchten Sie im Diagramm anzeigen.
ShowMouseTracking
Wenn true, wird ein Umriss um das Symbolfeld gezeichnet, über dem sich die Maus gerade befindet.
RefreshRateSeconds
Der Standardwert ist 5, was einfach bedeutet, dass die Daten für jedes Feld alle 5 Sekunden aktualisiert werden. Der Wert muss eine positive ganze Zahl sein, also etwas größer als 0.
ChartTemplateFilename
Der Dateiname der Vorlage, die beim Öffnen eines Diagramms verwendet werden soll. Wenn die angegebene Vorlage nicht gefunden wird, wird die Standardvorlage verwendet.
BackgroundColour
BullishColour
BearishColour
NeutralFarbe
Wählen Sie die gewünschte Farbe aus der MetaTrader-Standardauswahl.


Does exactly what it says on the tin. Saves a huge amount of time scanning markets, it's up to you how you apply the information it provides to you. You can't trade blindly from any scanner or indicator, that's not what this scanner is intended for. Author was very prompt to my email query re setup and configuration.