TheStrat FTFC MT5
- Indikatoren
-
Robert Gerald Wood
 Professioneller Softwareentwickler mit über 25 Jahren Erfahrung, der jetzt Tools für mich selbst erstellt und sie der breiteren Community zur Verfügung stellt.
 - Version: 1.2
- Aktualisiert: 16 Juni 2021
- Aktivierungen: 10
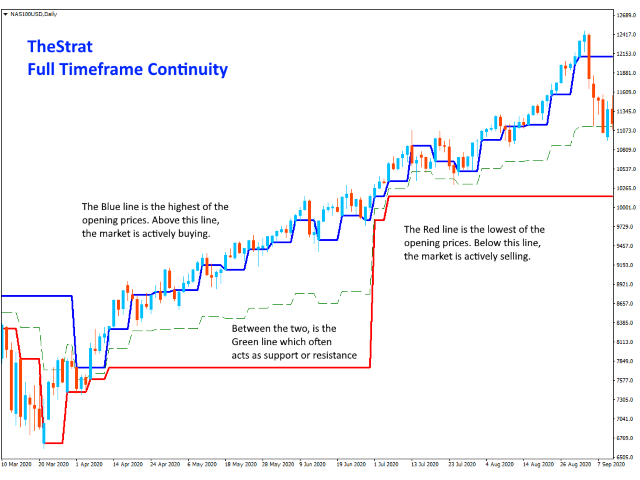
FTFC bezieht sich auf Full Timeframe Continuity, wie in Rob Smiths The Strat definiert.
Dieser Indikator zeichnet zwei Linien auf dem Chart, eine der höchsten der vierteljährlichen, monatlichen, wöchentlichen, täglichen oder stündlichen Eröffnungsniveaus und die zweite der niedrigsten dieser Werte. Dadurch erhalten Sie einen Kanal, über oder unter dem der Handel eher sehr stark in eine Richtung verläuft. Zwischen den Linien wird die Preisbewegung abgehackter und Sie können breitere Stopps verwenden.
Eine dritte gestrichelte Linie wird ebenfalls gezeichnet, um den Mittelpunkt zwischen den Hochs und Tiefs zu zeigen. Dies ist oft ein guter Ort, um Unterstützung oder Widerstand zu finden, wenn der Markt versucht, den Preis in eine bestimmte Richtung zu drücken. Diese Linie kann deaktiviert werden, wenn Sie dies wünschen, indem Sie die Farbe auf NONE setzen.
EINSTELLUNGEN
Quartalsebene einschließen
Ermöglicht es Ihnen, den vierteljährlichen Eröffnungskurs in die Berechnung einzubeziehen, da manche ihn lieber ignorieren.
IncludeCurrentTimeframeOpen
Wenn wahr, wenn der aktuell angezeigte Zeitrahmen H1, D1, W1 oder MN1 ist, schließt der Indikator diese offenen Perioden in seine Berechnung ein. Dies ist eine neue Einstellung in der neuesten Version des Indikators. Zuvor umfasste die Berechnung NICHT den aktuellen offenen Zeitraum, und dies stimmt nicht mit TheStrat überein.
Die Einstellung ist standardmäßig falsch, sodass vorhandene Benutzer nicht betroffen sind, es sei denn, sie aktivieren sie.
MaxMilliSecondsToCalculate
Bei Charts mit vielen geladenen Historien (über 10.000 Balken) begrenzt dies die Zeit, die der Indikator zum Initialisieren hat. Standardmäßig ist die Einstellung 1500 Millisekunden, also 1,5 Sekunden. Wenn es dem Indikator nach diesem Zeitraum nicht gelungen ist, alle seine Berechnungen für historische Balken durchzuführen, hört er auf, es zu versuchen. Das bedeutet, dass Sie immer einen aussagekräftigen Verlauf erhalten, aber sicher sein können, dass dies nicht dazu führt, dass Ihr Diagramm anhält.