TheStrat Levels MT5
- インディケータ
-
Robert Gerald Wood
 25年以上のプロのソフトウェア開発者であり、現在は自分用のツールを作成し、より広いコミュニティで共有しています。
私の製品の詳細については、https:// www.bunnywood.co.ukをご覧ください 。 - バージョン: 2.10
- アップデート済み: 18 6月 2021
- アクティベーション: 10
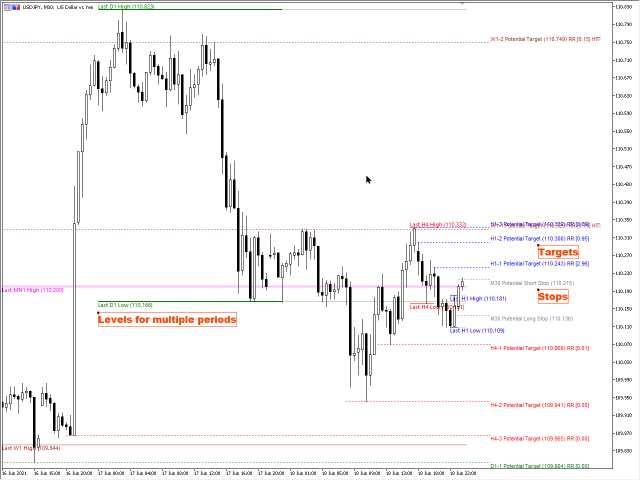
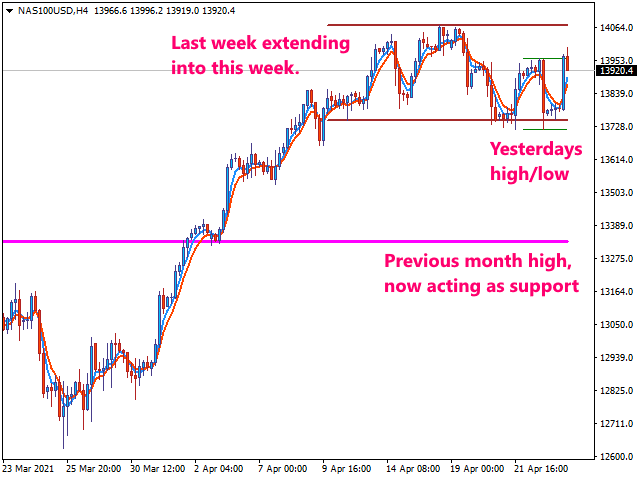
This indicator draws the prior Highs and Lows for multiple timeframes, and can display potential Take Profit and Stop Loss levels.
In Rob Smith's #The Strat terms, these are potential entry points, or alternatively potential targets for open positions. I like to use them in both ways. On a lower timeframe, say 5 minutes to get a good entry on a daily or weekly level, and then as a potential target. Very small stops required giving an excellent risk/reward ratio.
Key Features
- Levels from Hourly, Four Hourly, Daily, Weekly and Monthly timeframes- Potential Take Profit levels
- Potential Stop Loss levels based on the current or higher timeframe
- Risk / Reward calculated continuously for each potential target level based on potential stop level
- Pivot Machine Gun identification
- Labelling for each level so you can identify what there
- Comprehensive options to make it look as you wish
Please watch the DEMO video for more details as the pictures do not do the indicator justice.
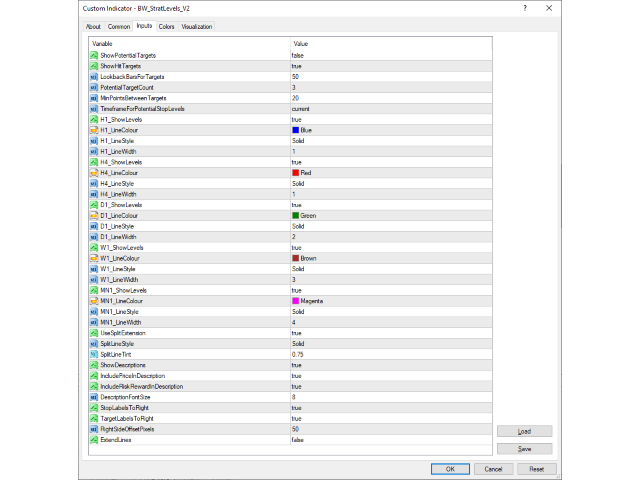
Settings
There are a number of settings, repeated for each timeframe.
ShowLevels
When true, the levels are drawn for this timeframe. The lines are drawn from the last period start to the current time. Once a new period is started, the lines will be redrawn to the new levels.
LineColour
You can set the line colour to any value from the standard colour selection.
LineStyle
The line style can vary from the simple solid line, dots, dashes or dots and dashes.
LineWidth
If the line style is solid, the line width can be any value from the selection available, 1 to 5.
UseSplitExtension
When set to True, the lines drawn are split into the historic part drawn using the line styles, width and colours above, and the projected part using a modified style based on the following settings.
SplitLineStyle
If you wish you can set the line style so it is clearly visibly different to the historic part of the line. If you set it to STYLE_SOLID, then the projected line will retain the width set above.
SplitLineTint
You can modify the colour of the projected line by giving it a tint. That is a reduction in intensity of the main colour selected for the historic line set above. The default value here is 0.5 which means halve the intensity of the colour.
Stop and Target Levels
ShowPotentialTargets
When true, potential target levels are shown for each timeframe enabled using the ShowLevels settings.
ShowHitTargets
When true, if a target level has been hit it will stay on the chart until the timeframe has expired. Otherwise, once hit, potential target levels are removed.
LookbackBarsForTargets
Controls how far back in the history the system should look for target levels. Default is 50 bars.
PotentialTargetCount
This allows you to choose how many potential target levels you want to see per timeframe. Default is 3.
MinPointsBetweenTargets
Having targets too close together is not very helpful, so this setting allows you to define how many points should be between one target and the next. Calculated per timeframe.
TimeframeForPotentialStopLevels
Allows you to choose the timeframe stop loss levels should be calculated from. By default it uses the current timeframe, giving a very tight stop loss.
Descriptive Labels
ShowDescriptions
When true, descriptive labels are drawn for every level shown.
IncludePriceInDescription
When true, puts the price value of the level in the description.
IncludeRiskRewardInDescription
When true, adds the risk / reward value in the description.
DescriptionFontSize
Choose how big the descriptive labels should be.
StopLabelsToRight
When true, the labels for stop levels are drawn to the right of the stop level. Set to false, the description will be drawn to the left of the level.
TargetLabelsToRight
When true, the labels for target levels are drawn to the right of the stop level. Set to false, the description will be drawn to the left of the level.
RightSideOffsetPixels
Allows you to choose how far from the current time the stop and target labels should be drawn. Only relevant if you use StopLabelsToRight or TargetLabelsToRight.
ExtendLines
By default, this is false. When True, the lines are extended off to the right hand side of the chart.
This greatly helps with being more mechanical with my trading