TheStrat Levels MT5
- Indicadores
-
Robert Gerald Wood
 Desarrollador de software profesional con más de 25 años, ahora construyo herramientas para mí y las comparto con la comunidad en general.
 - Versión: 2.10
- Actualizado: 18 junio 2021
- Activaciones: 10
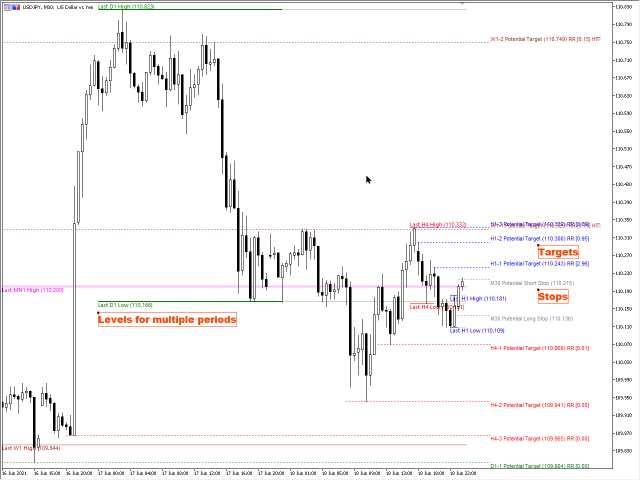
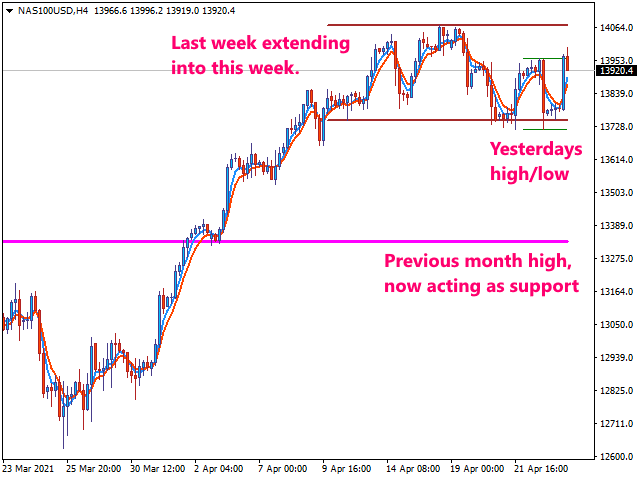
Este indicador dibuja los máximos y mínimos anteriores para múltiples marcos temporales, y puede mostrar los niveles potenciales de Take Profit y Stop Loss.
En términos de Rob Smith #TheStrat , estos son puntos de entrada potenciales, o alternativamente objetivos potenciales para posiciones abiertas. Me gusta utilizarlos de ambas maneras. En un marco de tiempo más bajo, digamos 5 minutos para obtener una buena entrada en un nivel diario o semanal, y luego como un objetivo potencial. Se requieren stops muy pequeños, lo que ofrece una excelente relación riesgo/recompensa.
Características principales
- Niveles de los marcos temporales horario, cuatrimestral, diario, semanal y mensual- Niveles potenciales de Take Profit
- Niveles potenciales de Stop Loss basados en el marco temporal actual o superior
- Riesgo / Recompensa calculado continuamente para cada nivel de objetivo potencial basado en el nivel de stop potencial
- Identificación de Ametralladora Pivot
- Etiquetado para cada nivel para que pueda identificar lo que hay
- Opciones completas para que tenga el aspecto que desee
Por favor, vea el vídeo DEMO para más detalles ya que las imágenes no hacen justicia al indicador.
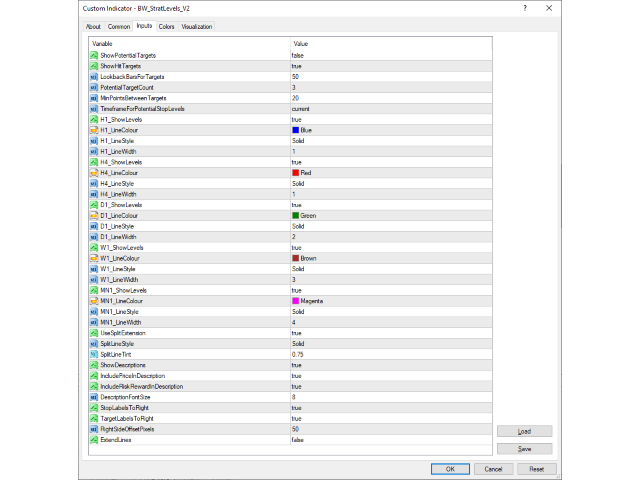
Ajustes
Hay una serie de ajustes, que se repiten para cada marco temporal.
MostrarNiveles
Cuando es verdadero, se dibujan los niveles para este marco temporal. Las líneas se dibujan desde el inicio del último periodo hasta la hora actual. Cuando se inicia un nuevo periodo, las líneas se redibujan a los nuevos niveles.
LineColour
Puede establecer el color de la línea en cualquier valor de la selección de colores estándar.
LineStyle
El estilo de línea puede variar entre línea continua simple, puntos, rayas o puntos y rayas.
LineWidth
Si el estilo de línea es sólido, el ancho de línea puede ser cualquier valor de la selección disponible, de 1 a 5.
UseSplitExtension
Cuando se establece en True, las líneas dibujadas se dividen en la parte histórica dibujada utilizando los estilos de línea, anchura y colores anteriores, y la parte proyectada utilizando un estilo modificado basado en los siguientes ajustes.
SplitLineStyle
Si lo desea, puede establecer el estilo de línea de modo que sea visiblemente diferente de la parte histórica de la línea. Si lo establece en STYLE_SOLID, la línea proyectada conservará la anchura establecida anteriormente.
SplitLineTint
Puede modificar el color de la línea proyectada dándole un matiz. Se trata de una reducción de la intensidad del color principal seleccionado para la línea histórica. El valor por defecto es 0,5, lo que significa reducir a la mitad la intensidad del color.
Niveles de parada y objetivo
MostrarObjetivosPotenciales
Cuando es verdadero, se muestran los niveles de objetivos potenciales para cada marco de tiempo habilitado utilizando la configuración de ShowLevels .
MostrarObjetivosPotenciales
Cuando es verdadero, si un nivel objetivo ha sido alcanzado, permanecerá en el gráfico hasta que el marco temporal haya expirado. En caso contrario, una vez alcanzado, se eliminan los posibles niveles objetivo.
LookbackBarsForTargets
Controla cuánto tiempo atrás en el historial debe buscar el sistema los niveles objetivo. Por defecto son 50 barras.
PotentialTargetCount
Le permite elegir cuántos niveles objetivo potenciales desea ver por marco de tiempo. Por defecto es 3.
MinPointsBetweenTargets
Tener objetivos demasiado juntos no es muy útil, por lo que este ajuste le permite definir cuántos puntos debe haber entre un objetivo y el siguiente. Calculado por marco temporal.
TimeframeForPotentialStopLevels
Le permite elegir el marco temporal a partir del cual se calcularán los niveles de stop loss. Por defecto utiliza el timeframe actual, dando un stop loss muy ajustado.
Etiquetas descriptivas
MostrarDescripciones
Cuando es true, se dibujan etiquetas descriptivas para cada nivel mostrado.
IncluirPrecioEnDescripción
Cuando es true, pone el valor del precio del nivel en la descripción.
IncludeRiskRewardInDescription
Cuando es true, añade el valor de riesgo / recompensa en la descripción.
DescriptionFontSize
Elige el tamaño de las etiquetas descriptivas.
StopLabelsToRight
Cuando está en true, las etiquetas de los niveles de parada se dibujan a la derecha del nivel de parada. Si se establece en false, la descripción se dibujará a la izquierda del nivel.
TargetLabelsToRight
Si es true, las etiquetas de los niveles objetivo se dibujan a la derecha del nivel de stop. Si se establece en false, la descripción se dibujará a la izquierda del nivel.
RightSideOffsetPixels
Le permite elegir a qué distancia del tiempo actual deben dibujarse las etiquetas de stop y objetivo. Sólo es relevante si utiliza StopLabelsToRight o TargetLabelsToRight.
ExtenderLíneas
Por defecto es falso. Cuando es True, las líneas se extienden hacia la derecha del gráfico.
This greatly helps with being more mechanical with my trading