Elliot Waves Analyzer
- Indikatoren
- Version: 1.1
- Aktualisiert: 11 Februar 2021
Elliot-Wellen-Analysator
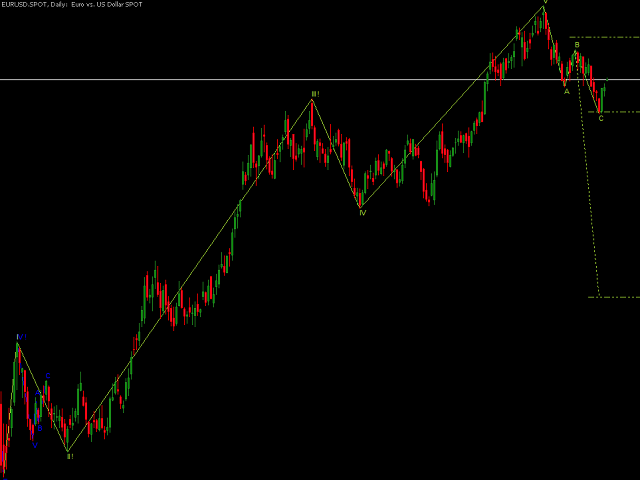
berechnet Elliot Waves, um die Trendrichtung und Einstiegslevels zu identifizieren. Hauptsächlich für Swing-Trading-Strategien.
Normalerweise würde man eine Position in Trendrichtung für Welle 3 oder eine Korrektur für Welle C eröffnen.
Dieser Indikator zeichnet die Zielniveaus für die aktuelle und die nächste Welle. Die wichtigsten Regeln für die Elliot-Wellen-Analyse werden durch den Indikator verifiziert.
Diese kostenlose Version ist auf die Analyse von Wellen für eine Zeitperiode beschränkt. Die Wellen werden nur in PERIOD_H4 und höher angezeigt. Nicht geeignet für Intraday-Handelsstrategien.
Die Vollversion zeigt Subwaves und alle TimePeriods.
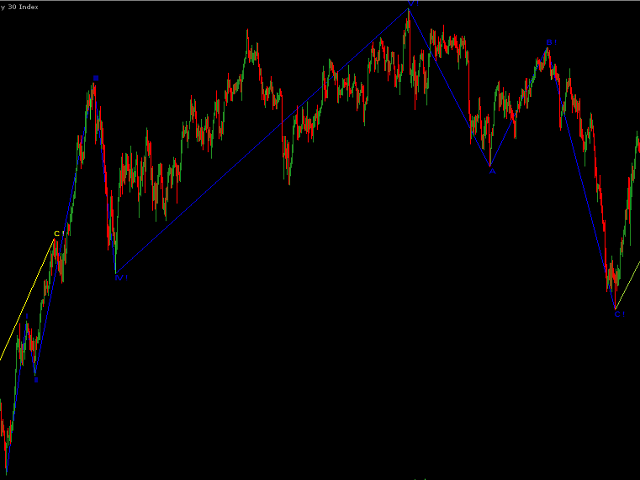


A good indicator which gives labels of the waves along with the waves.