Rsi Trend Finder
- Experten
- Version: 1.0
- Aktivierungen: 5

https://www.youtube.com/watch?v=ygibWOftQ7c <---- HIER KÖNNEN SIE SEHEN, WIE ER VISUELL GEHANDELT WIRD
Währung - Eur/Usd
Candle Time - 1m für beste Ergebnisse (funktioniert auf mehreren Zeitrahmen)
Empfohlener Broker - IG (funktioniert bei den meisten)
Hebelwirkung - 1:200
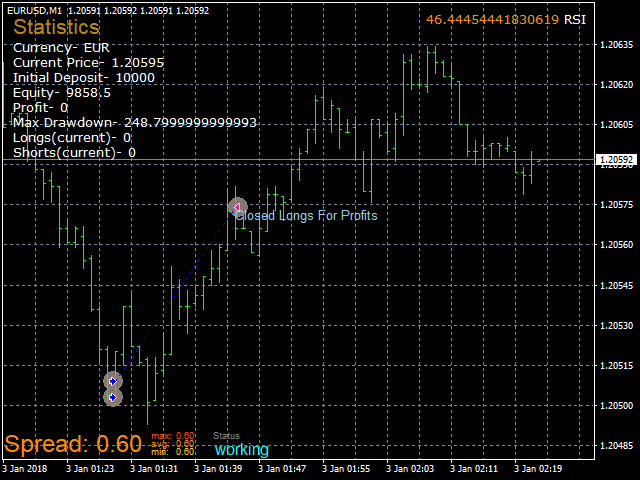
Vollautomatischer EA für Longs und Shorts Sie können die RSI-Periode und den RSI-Wert nach Belieben einstellen.
RSI-PERIODEN UND -WERTE, WENN SIE SICH KREUZEN, SIND ALLE IN DEN EINGABEN EINSTELLBAR, EBENSO WIE DIE FARBE DER WÖRTER UND ZAHLEN.
Die Standardeinstellungen sind...
LONGS - sind zu kaufen, wenn der RSI unter 15 kreuzt. Wenn der RSI für Longs über 70 kreuzt, wird er als CLOSED FOR PROFITS markiert .
SHORTS - werden verkauft, wenn der RSI über 75 kreuzt. Wenn der RSI für Shorts unter 20 kreuzt, wird er alsGESCHLOSSEN FÜR PROFITE markiert.
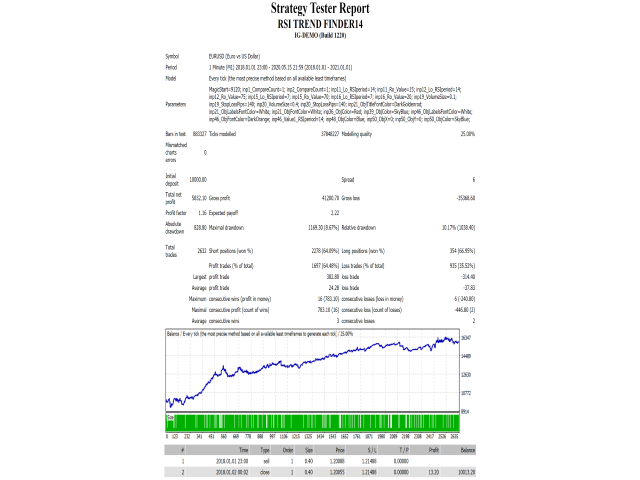
-VERWENDUNG ALS EXPERT ADVISOR
-BACKTESTING ENTSPRICHT DER LIVE-DEMO
2018 - MAI 16, 2020
Bars in test    883327
Ticks modelled  37848227
Modelling quality       25.00%
Mismatched charts errors        0
Initial deposit 10000.00
Spread  6
Total net profit        5832.10
Gross profit    41200.70
Gross loss      -35368.60
Profit factor   1.16
Expected payoff 2.22
Absolute drawdown       828.80
Maximal drawdown        1169.30 (8.67%)
Relative drawdown       10.17% (1038.40)
Total trades    2632
Short positions (won %) 2278 (64.09%)
Long positions (won %)  354 (66.95%)
Profit trades (% of total)      1697 (64.48%)
Loss trades (% of total)        935 (35.52%)
        Largest
profit trade    382.80
loss trade      -314.40
        Average
profit trade    24.28
loss trade      -37.83
        Maximum
consecutive wins (profit in money)      16 (783.10)
consecutive losses (loss in money)      6 (-240.80)
        Maximal
consecutive profit (count of wins)      783.10 (16)
consecutive loss (count of losses)      -446.80 (2)
        Average
consecutive wins        3
consecutive losses      2