Market Momentum PRO
- Indicadores
-
Flavio Javier Jarabeck
 We are a closed brotherhood of traders whose ultimate goal is to profit through well-studied, structured, and automated trades. As a result, we publish dozens of MT5 indicators (FREE and paid) to the global MQL5 community. 80% of our published products are high-quality free indicators so beginner
 - Versión: 1.3
- Actualizado: 8 mayo 2023
- Activaciones: 20
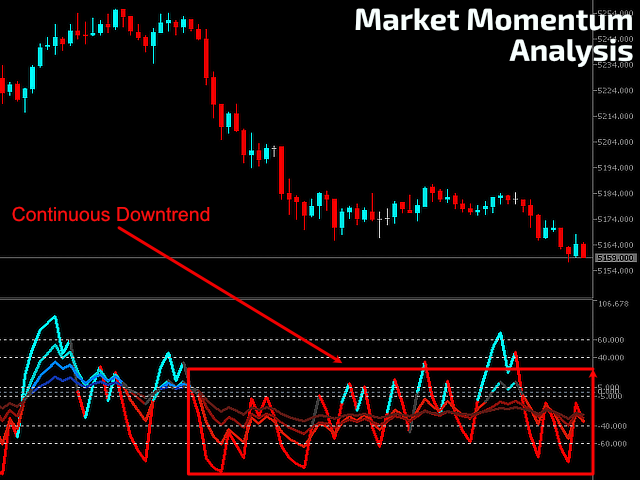
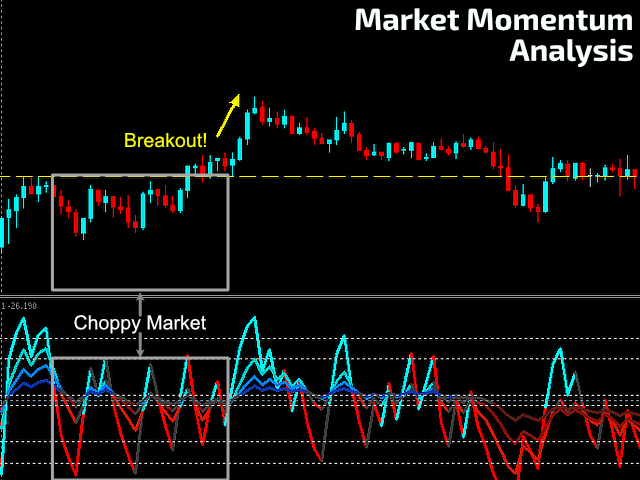
El indicador Market Momentum se basa en el Oscilador de Zona de Volumen (VZO), presentado por Waleed Aly Khalil en la edición de 2009 de la revista de la Federación Internacional de Analistas Técnicos , y presenta una nueva visión de este valioso dato del mercado que a menudo se malinterpreta y descuida: EL VOLUMEN. Con este nuevo enfoque de "ver" los datos de Volumen, los operadores pueden inferir más adecuadamente el comportamiento del mercado y aumentar sus probabilidades en una operación ganadora.
"The VZO is a leading volume oscillator; its basic usefulness is in giving leading buy/sell signals based on volume conditions, also to identify overbought/oversold volume conditions, along with mega overbought/oversold situations which lead to a change in sentiment, and most probably, leads to change of the current trend in the timeframe being studied."
"El precio viene precedido por el volumen; esa es otra idea importante en el análisis técnico. Si el volumen empieza a disminuir en una tendencia alcista, suele ser una señal que indica que la racha alcista está a punto de terminar."
"Creemos que el volumen debe tener la misma importancia que el precio y debe vigilarse de cerca".
"Uno de los principales beneficios del VZO es principalmente poder identificar en qué zona se posiciona el volumen, para decidir de qué lado debemos montar."
-- Waleed Aly Khalil
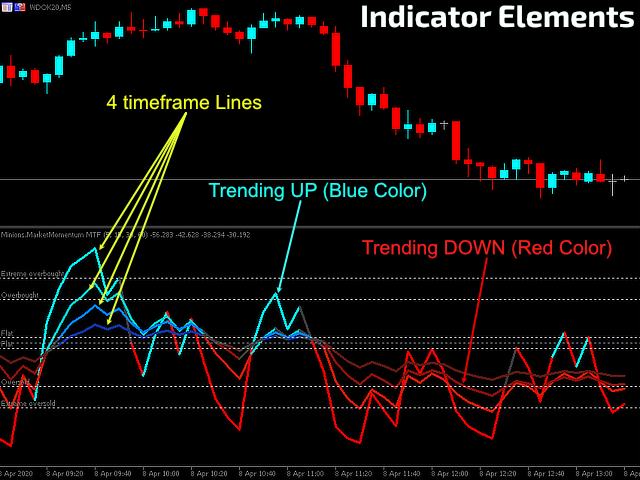
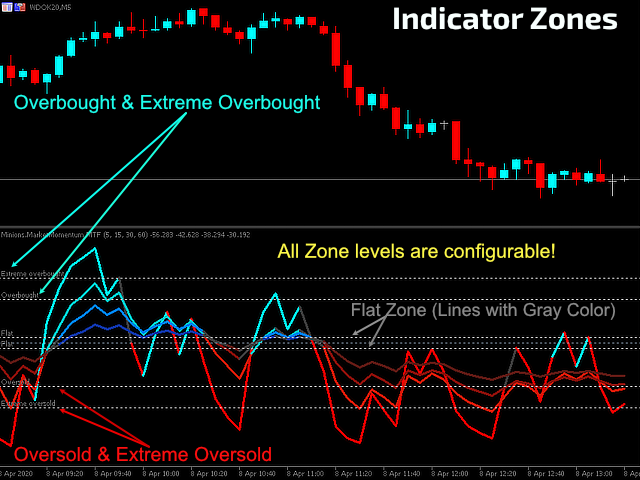
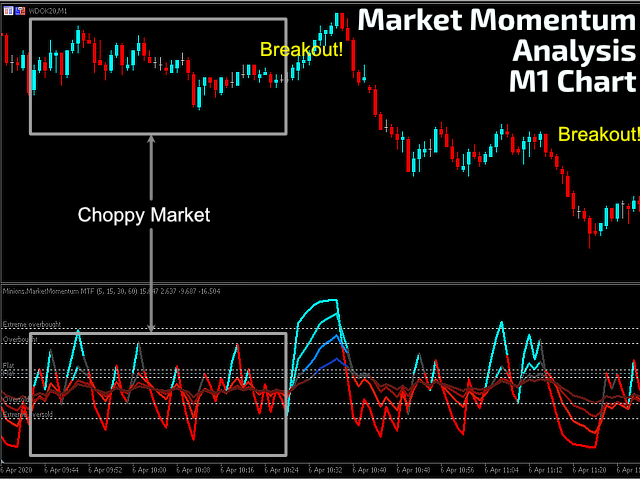
El indicador de Momento del Mercado guía visualmente a los operadores cuando el mercado está por encima o por debajo de la línea CERO, indicando el "lado" probable del mercado. Puede adaptar cuándo el indicador coloreará las líneas del oscilador cambiando los valores "Planos".
También puede probar la teoría del cruce de los umbrales de Sobrecompra y Sobreventa. O, entrando en las Zonas y prestando atención cuando el oscilador sale de las Zonas, vigilando divergencias, etc...
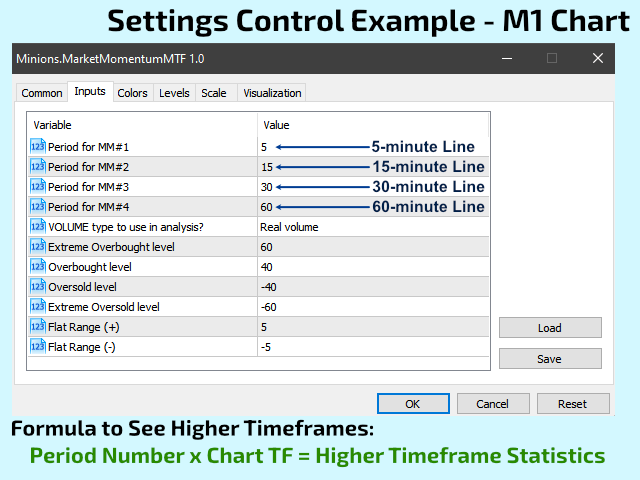
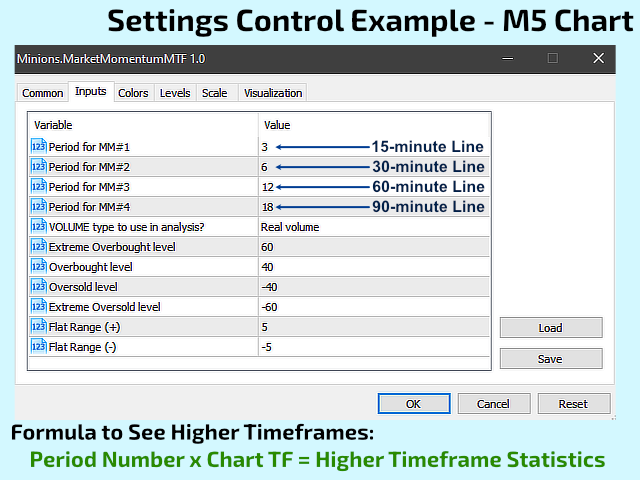
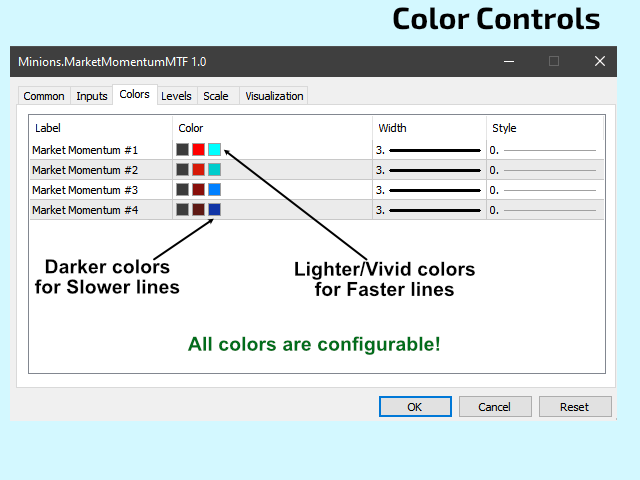
** El giro si esta versión PRO es la adición de 4 posibles cálculos timeframe que se pueden añadir dentro del indicador. De esta manera usted puede tener la estadística visual de 4 (CUATRO) diferentes marcos de tiempo dentro de la misma ventana del indicador. Por favor, vea las capturas de pantalla a continuación con todos los ejemplos e instrucciones.
AJUSTES
- Periodo de Análisis (barras)
- Tipo de Volumen a Analizar (Ticks o Volumen Real)
- Sub-ventana del indicador Niveles:
- Sobrecompra
- Sobrecompra Extrema
- Sobreventa
- Sobreventa Extrema
- Nivel de Mercado Plano
- Todas las configuraciones óptimas dependerán únicamente del análisis sobre el Símbolo y el Marco de Tiempo que usted pretenda operar.
- Este es un gran indicador, pero NO es Mágico. Utilícelo con otras herramientas/análisis para aumentar las probabilidades de su operación.
Si desea probar la versión básica de Market Momentum, obtenga una copia GRATIS aquí...
¡Larga Vida y Prosperidad!
;)