Investing Technical Analysis Ind
- Indikatoren
- Version: 2.1
- Aktualisiert: 22 März 2020
- Aktivierungen: 5
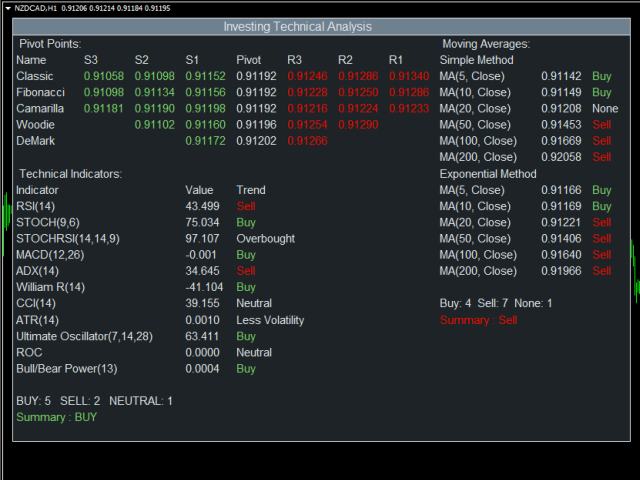
Dieser Indikator bietet einen technischen Überblick mit Hilfe der folgenden Instrumente:
- Pivot-Punkte
- Technische Indikatoren
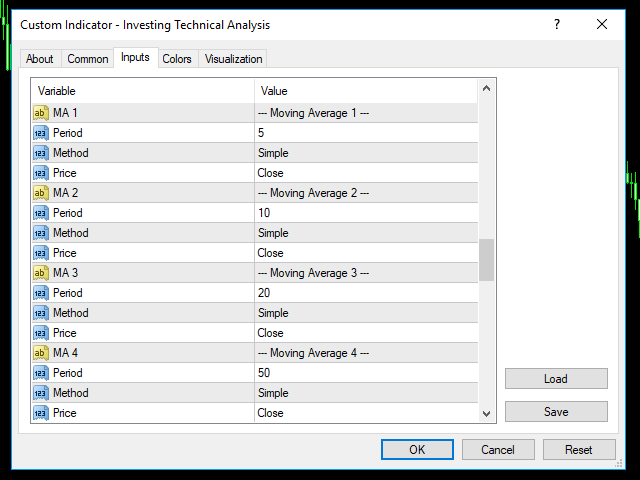
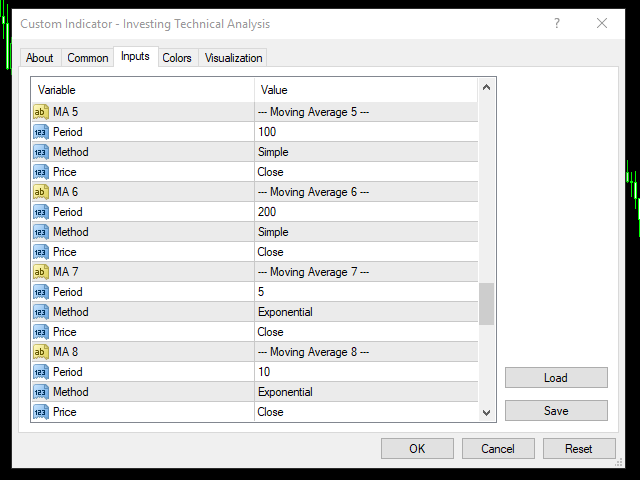
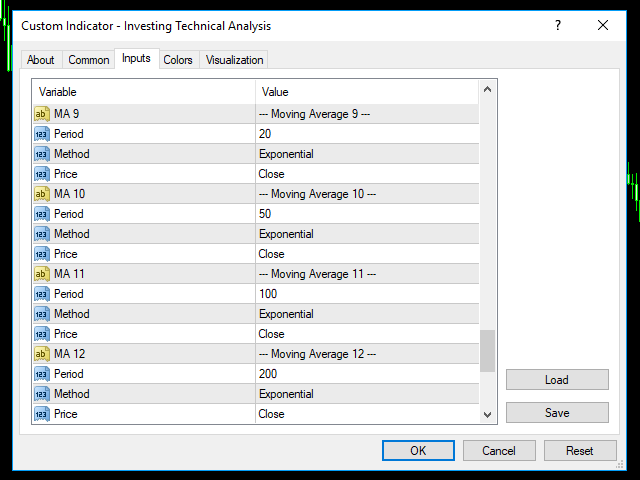
- Gleitende Durchschnitte
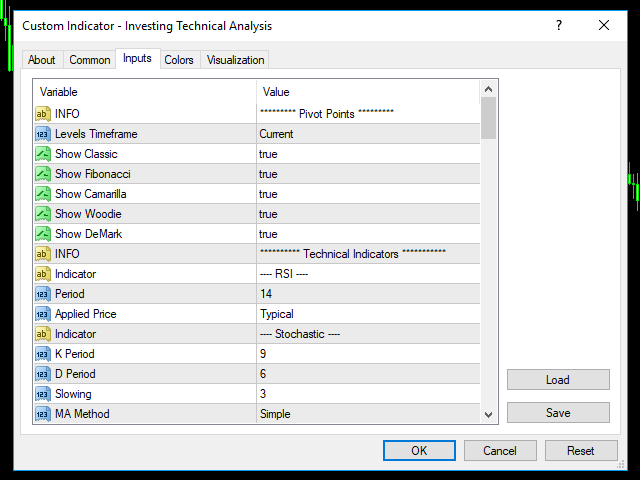
Pivot-Punkte werden mit fünf verschiedenen Methoden berechnet:
- Klassisch
- Fibonacci
- Camarilla
- Woodie
- DeMark
Mit dem technischen Indikator können Sie die Handelssignale durch die Kombination verschiedener Indikatoren finden. Er unterstützt die folgenden technischen Indikatoren:
- RSI
- Stochastik
- Stochastischer RSI
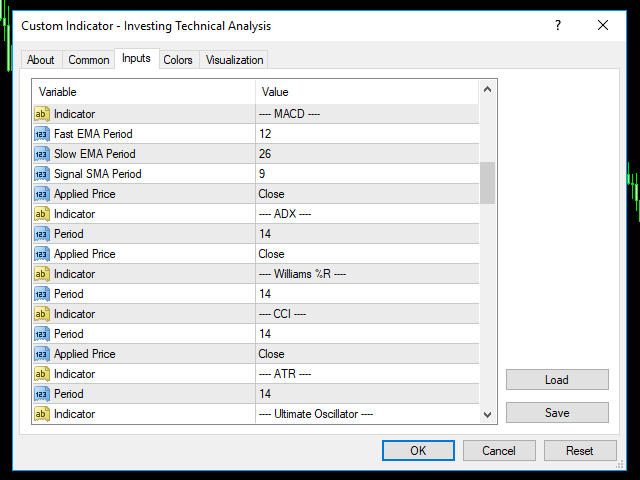
- MACD
- ADX
- CCI
- ATR
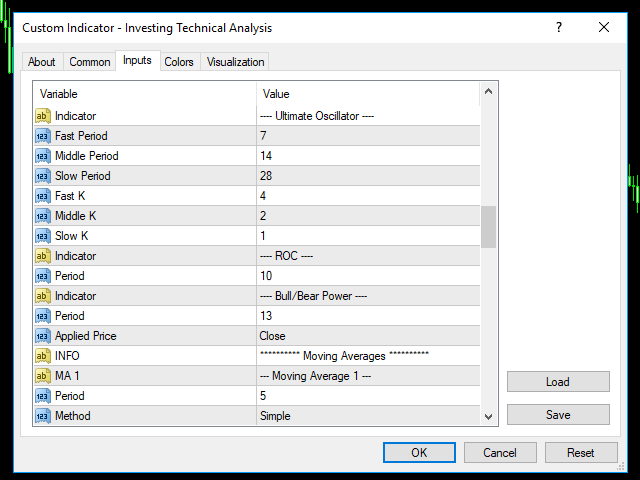
- Ultimativer Oszillator
- ROC
- Bull/Bear Power
Gleitende Durchschnitte werden verwendet, um die Richtung des Trends anhand mehrerer gleitender Durchschnittsindikatoren zu ermitteln. Die Berechnung erfolgt nach den folgenden Regeln:
-Ask < MA, ist es SELL
-Bid > MA, es ist BUY
-Ask > MA > Bid, es ist None (kein Signal)
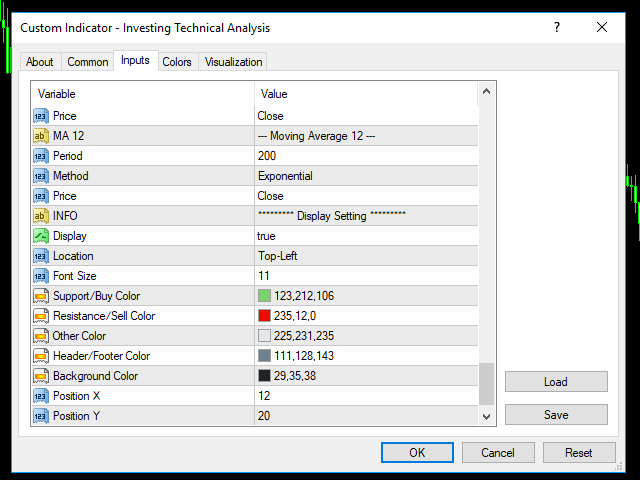
Nachdem Sie den Indikator an ein Diagramm angehängt haben, zeigt er die folgenden Informationen auf dem Diagramm an:
- Pivot-Punkt-Niveaus
- Technische Indikatoren, ihre Werte und das von ihnen erzeugte Signal.
- Anzahl der Käufe und Verkäufe
- Zusammenfassung: Schlussfolgerung
- Mehrere MAs, geordnet nach ihrer Methode
- Kauf- und Verkaufszählung
- Zusammenfassung: Schlussfolgerung
Sie können alle im Diagramm angezeigten Informationen ausblenden, indem Sie bei Display Setting die Einstellung false wählen.