Channel Breakout Ind
- Indikatoren
- Version: 2.1
- Aktualisiert: 22 März 2020
- Aktivierungen: 5
Kontaktieren Sie uns für jede kundenspezifische Bestellung,CodeYourTrade.com.
Der Channel Breakout-Indikator zeigt die Kanäle auf der Grundlage der Anzahl der Balken an. Er wird für den Handel mit Ausbrüchen oder Umkehrungen verwendet.
Breakout ist sehr effizient, da er versucht, Gewinne zu erzielen, wenn der Markt zusammenbricht!!! Sie können auch Ihre eigene Technik daraus entwickeln.
Nachdem Sie den Indikator an ein Diagramm angehängt haben, zeigt er die folgenden Informationen auf dem Diagramm an:
1. die Informationen zu Kanal 1 und Kanal 2
2. die Informationen zu Alarmen und E-Mails
Sie können alle im Chart angezeigten Informationen ausblenden, indem Sie false auf Display setzen.
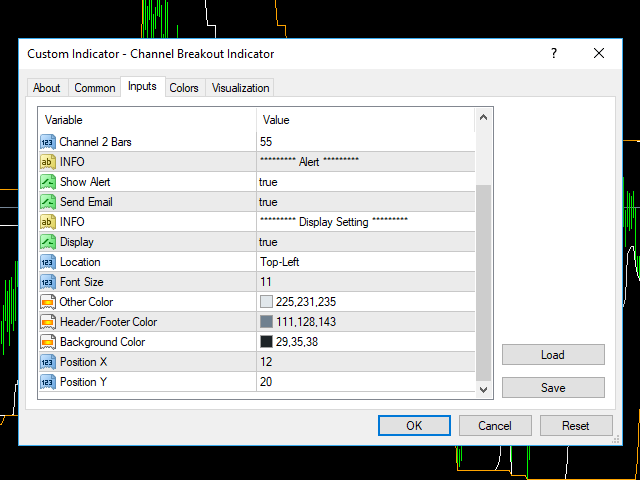
Einstellung des Indikators
Haupt-Einstellung
- Kanal 1 aktivieren: Wenn true, wird Kanal 1 angezeigt .
- Kanal 1 Balken: Anzahl der Balken, die verwendet werden, um Kanal 1 zu finden
- Enable Channel 2: Wenn wahr, wird Kanal 2 angezeigt.
- Kanal 2 Balken: Anzahl der Balken, die für die Suche nach Kanal 2 verwendet werden
Warnung
- Alert anzeigen: Zeigt das Alert-Feld an .
- E-Mail senden: Sendet eine E-Mail
Einstellung anzeigen
- Anzeigen: Zeigt die Indikatorinformationen im Diagramm an.
- Standort: Position des Anzeigefensters
- Oben-links: Zeigt alle Details oben-links an
- Unten-links: Anzeige aller Details unten-links
- Schriftgröße: Größe der Schriftart
- Andere Farbe: Allgemeine Farbe
- Kopf-/Fußzeilenfarbe: Kopf- und Fußzeilenfarbe des Anzeigefensters
- Hintergrundfarbe: Hintergrundfarbe des Anzeigefensters
- Position X: Position des Anzeigefensters auf der X-Achse
- Position Y: Position der Y-Achse des Anzeigefensters