Trade Notifier Ind
- Indikatoren
- Version: 1.0
- Aktivierungen: 5
Kontaktieren Sie uns für jede kundenspezifische Bestellung,CodeYourTrade.com.
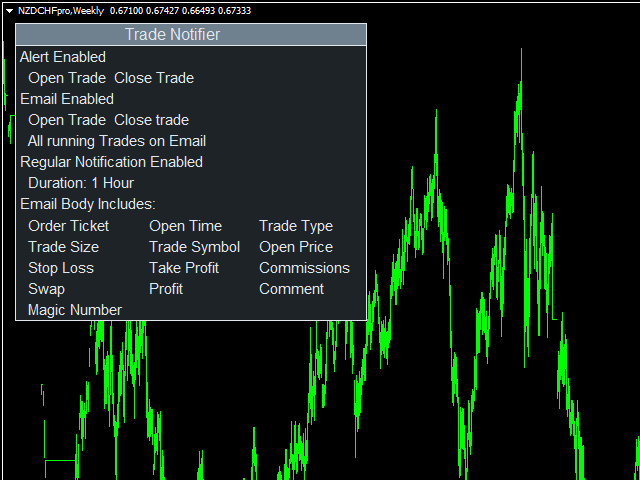
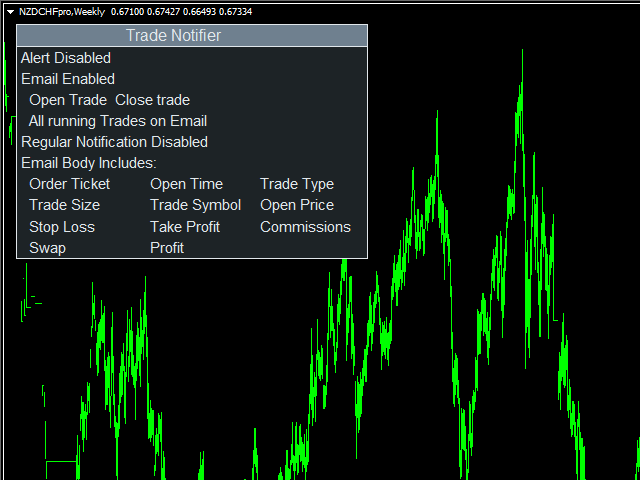
Der Indikator Trade Notifier wird verwendet, um das Öffnen oder Schließen von Trades per E-Mail oder Alarm zu melden. Er kann auch regelmäßige Handelsaktualisierungen per E-Mail senden.
Nachdem Sie den Indikator an ein Diagramm angehängt haben, zeigt er die folgenden Informationen auf dem Diagramm an:
1. die Informationen des Alarms
2. die E-Mail-Informationen
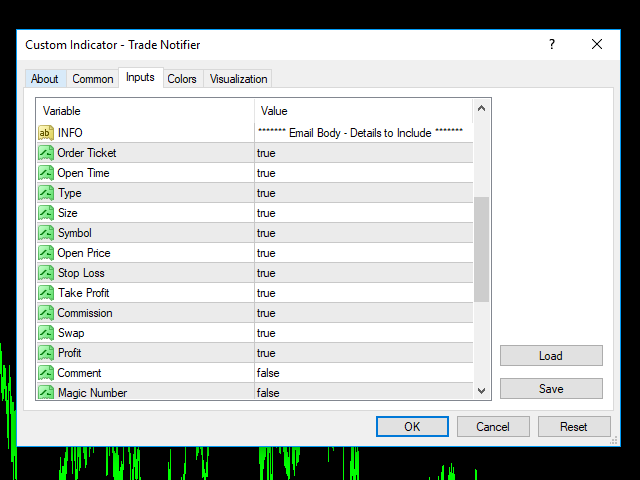
3. die in die E-Mail aufzunehmenden Details
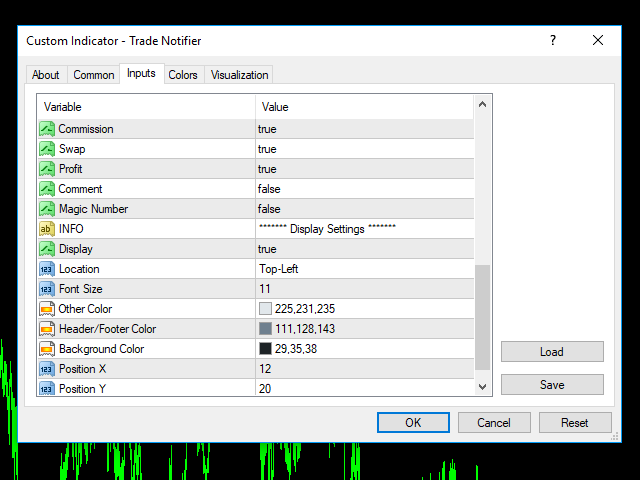
Sie können alle Informationen, die im Chart angezeigt werden, ausblenden, indem Sie "false" auf "Display" setzen.
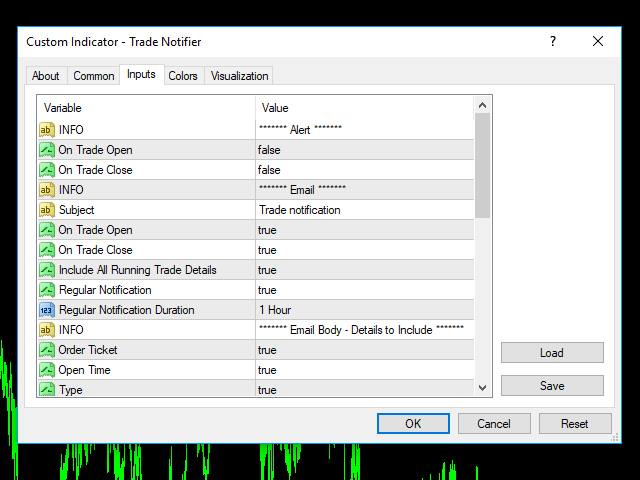
Einstellungen des Indikators
Warnung
- Bei Handelseröffnung: Wenn ja, wird bei jeder Handelseröffnung ein Alarm angezeigt.
- Bei Handelsschluss: Wenn ja, wird bei jedem Handelsschluss ein Alarm angezeigt .
- Betreff: Betreff der E-Mail
- On Trade Open: Falls zutreffend, wird bei jeder Handelseröffnung eine E-Mail gesendet.
- Bei Handelsschluss: Falls zutreffend, wird bei jedem Handelsabschluss eine E-Mail gesendet.
- Include All Running Trade Details: Aktiviert die regelmäßige E-Mail-Benachrichtigung
- Regelmäßige Benachrichtigung: Bei "true" wird eine regelmäßige E-Mail-Benachrichtigung gesendet.
- Dauer der regelmäßigen Benachrichtigung: Intervall, in dem die regelmäßige E-Mail-Benachrichtigung gesendet werden soll. Die folgenden Optionen sind verfügbar:
- 1 Minute
- 5 Minuten
- 15 Minuten
- 30 Minuten
- 1 Stunde
- 4 Stunden
- 1 Tag
- 1 Woche