Stochastic RSI Ind
- Indikatoren
- Version: 1.0
- Aktivierungen: 5
Kontaktieren Sie uns für jede kundenspezifische Bestellung,CodeYourTrade.com.
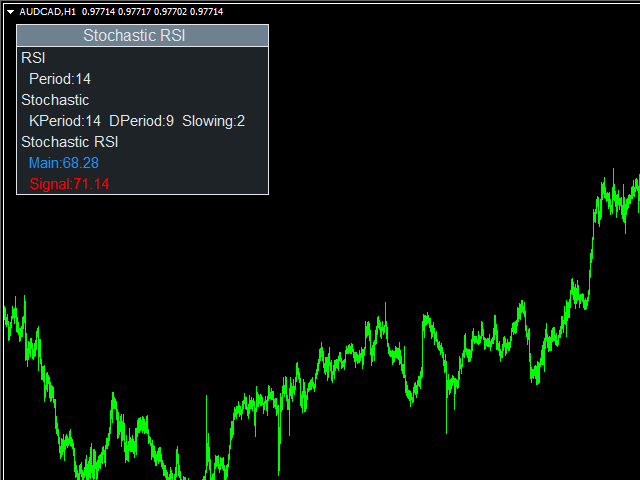
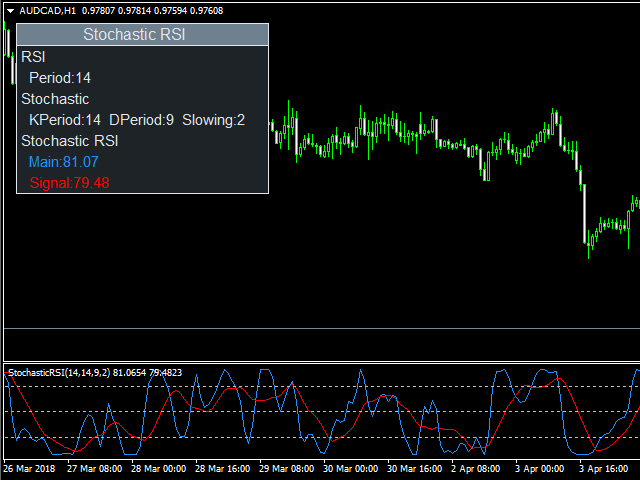
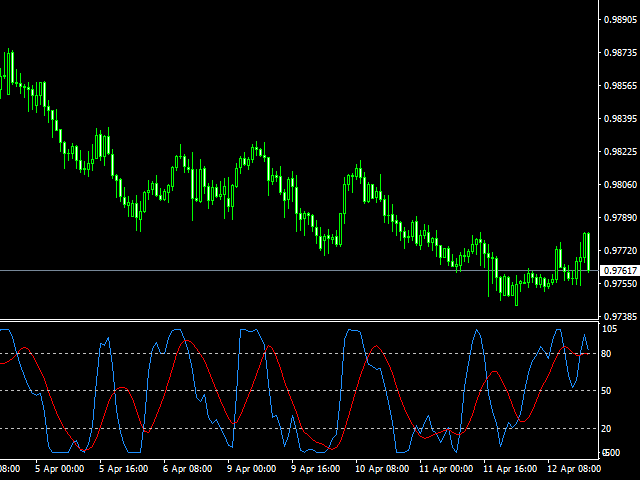
Der stochastische RSI-Indikator ist im Wesentlichen ein Indikator eines Indikators. Er wird in der technischen Analyse verwendet, um dem RSI-Indikator eine stochastische Berechnung hinzuzufügen. Das bedeutet, dass er den RSI im Verhältnis zu seiner eigenen Hoch-/Tiefspanne über einen benutzerdefinierten Zeitraum misst. Dieser Indikator wird in erster Linie zur Erkennung von überkauften und überverkauften Bedingungen verwendet.
Sie können alle im Chart angezeigten Informationen ausblenden, indem Sie die Option Im Chart anzeigen auf false setzen.
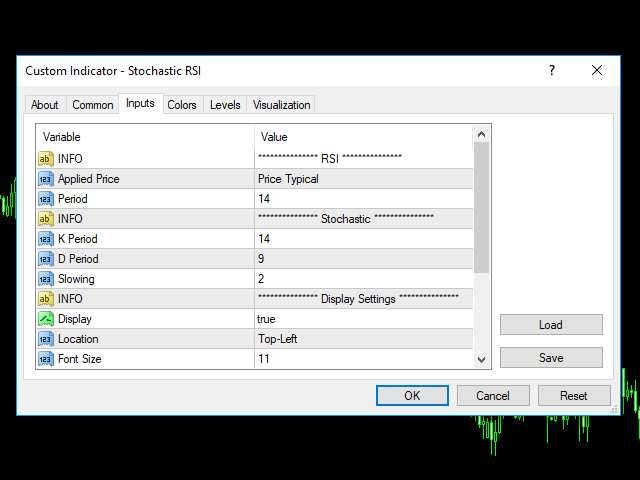
Einstellung des Indikators
RSI
- Angewandter Preis: Methode
- Schließen
- Öffnen
- Hoch
- Tief
- Median
- Typisch
- Gewichtet
- Periode: Anzahl der Perioden für die RSI-Berechnung
Stochastisch
- K Periode: Anzahl der Zeiträume für die stochastische Berechnung
- D Periode: Anzahl der Zeitperioden für die Berechnung eines gleitenden Durchschnitts der K-Periode
- Verlangsamung: Interne Glättung von K Periode. Ein Wert von 1 gilt als schnelle Stochastik und ein Wert von 3 als langsame Stochastik
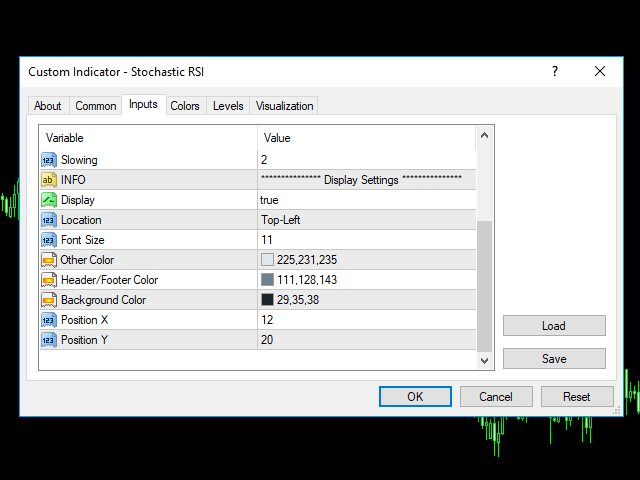
Einstellung der Anzeige
- Anzeige: Zeigt die Indikatorinformationen im Chart an
- Ort: Position des Anzeigefensters
- Oben-links: Zeigt alle Details oben-links an
- Unten-links: Anzeige aller Details unten-links
- Schriftgröße: Größe der Schriftart
- Andere Farbe: Allgemeine Farbe
- Kopf-/Fußzeilenfarbe: Kopf- und Fußzeilenfarbe des Anzeigefensters
- Hintergrundfarbe: Hintergrundfarbe des Anzeigefensters
- Position X: Position des Anzeigefensters auf der X-Achse
- Position Y: Position der Y-Achse des Anzeigefensters