Investing Technical Analysis Ind
- Indicateurs
- Version: 2.1
- Mise à jour: 22 mars 2020
- Activations: 5
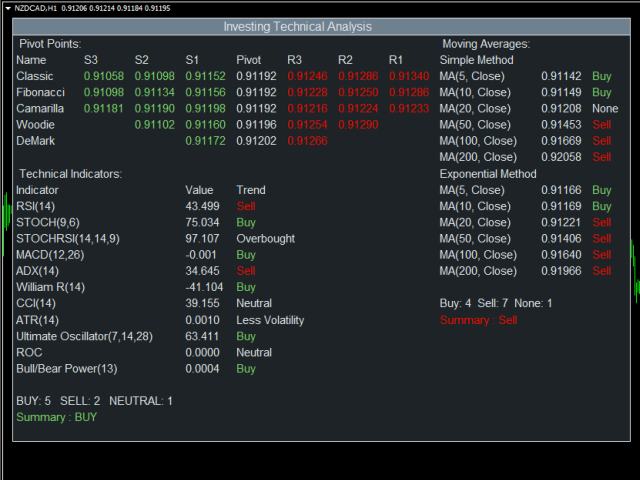
This indicator provides the technical overview using following tools:
- Pivot Points
- Technical Indicators
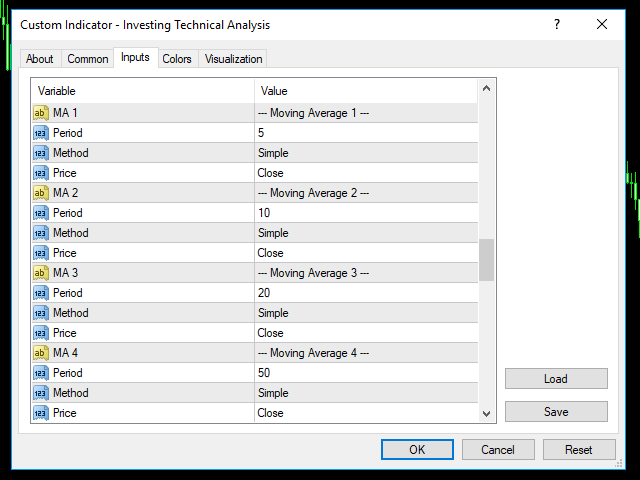
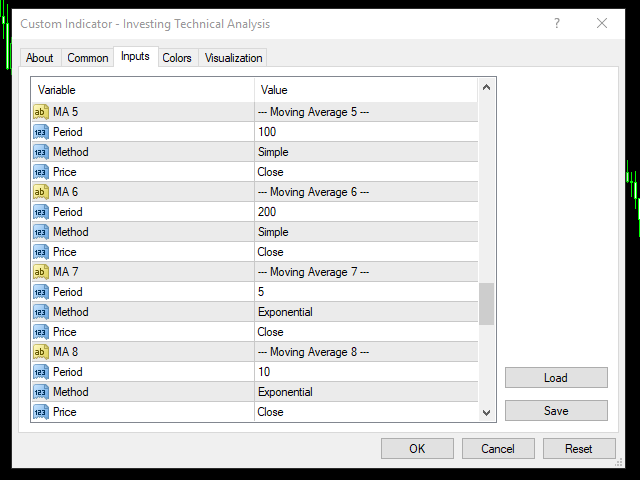
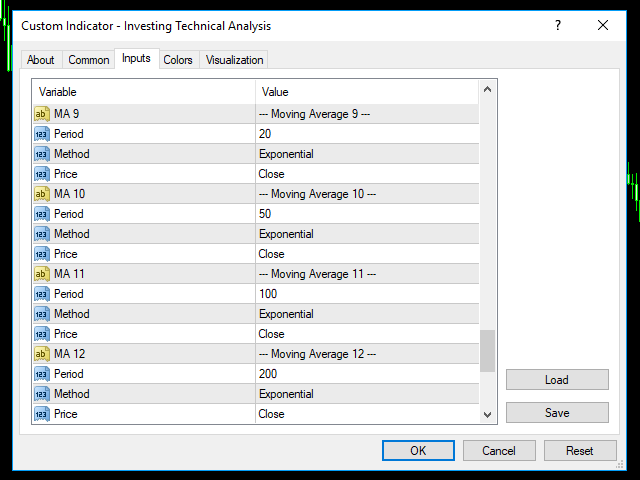
- Moving Averages
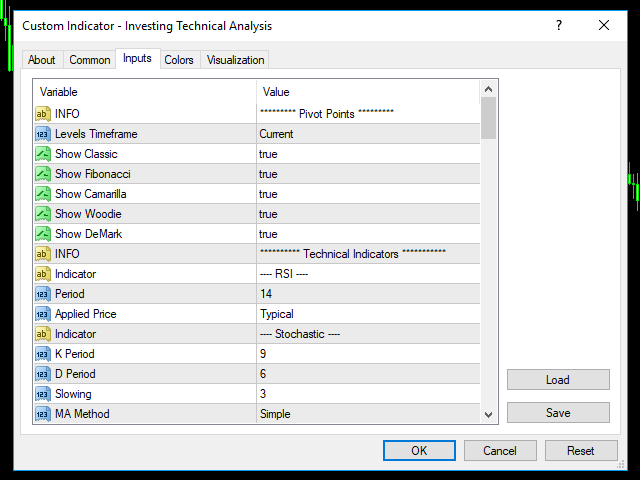
Pivot Points are calculated using five different methods:
- Classic
- Fibonacci
- Camarilla
- Woodie
- DeMark
With the technical indicator, you can find the trading signals using the combination of different indicators. It supports the following technical indicators:
- RSI
- Stochastic
- Stochastic RSI
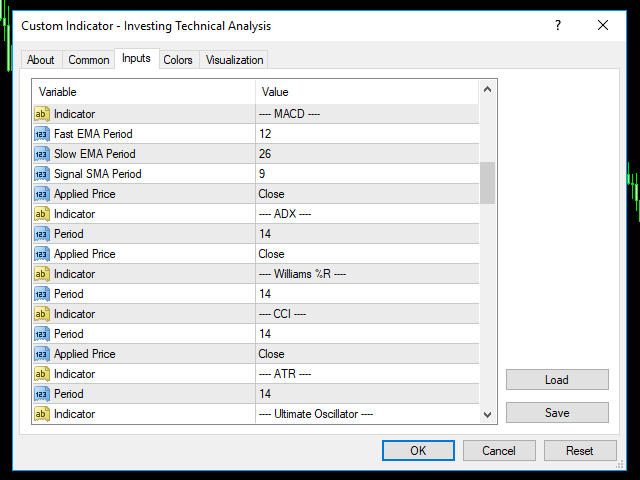
- MACD
- ADX
- CCI
- ATR
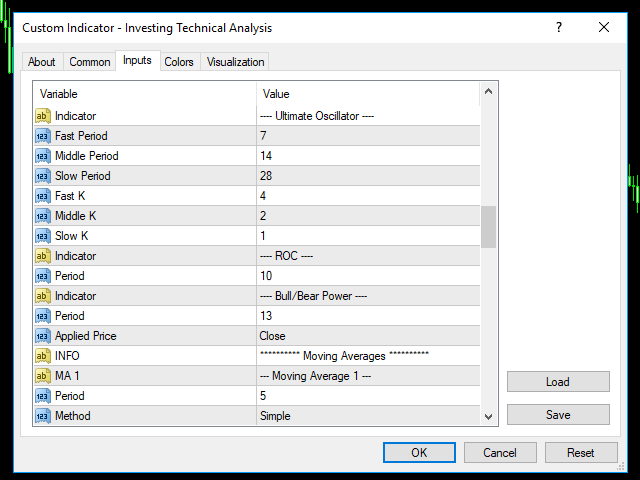
- Ultimate Oscillator
- ROC
- Bull/Bear Power
Moving Averages is used to find the direction of the trend using multiple Moving Average indicators. It calculates using the following rules:
· Ask < MA, it is SELL
· Bid > MA, it is BUY
· Ask > MA > Bid, it is None (no signal)
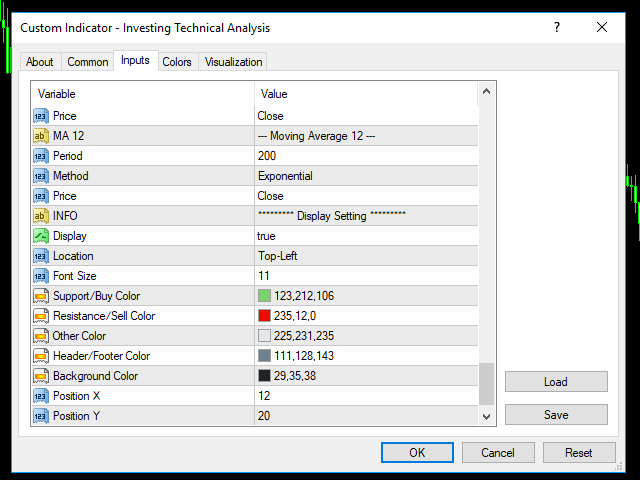
After you attached the indicator to a chart it will show the following information on the chart:
- Pivot point levels
- Technical indicators, their values and the signal generated from them.
- Buy and Sell count
- Summary: Conclusion
- Multiple MAs arranged by their method
- Buy and Sell count
- Summary: Conclusion
You can hide all the information displayed in the chart by setting false to Display on Display Setting.