Investing Technical Analysis Ind
- Indicadores
- Versión: 2.1
- Actualizado: 22 marzo 2020
- Activaciones: 5
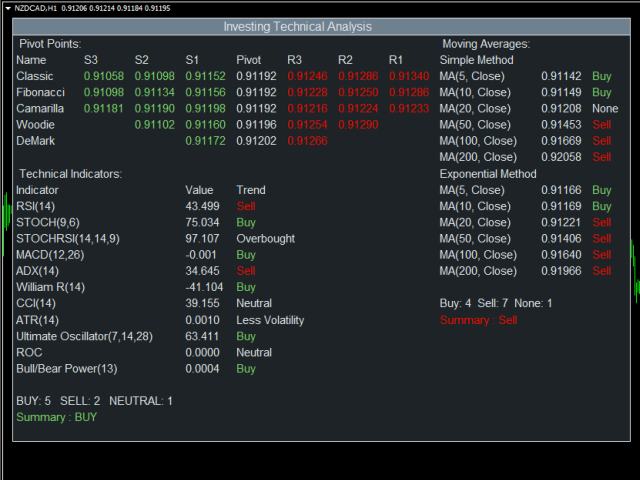
Este indicador proporciona la visión técnica utilizando las siguientes herramientas:
- Puntos de giro
- Indicadores técnicos
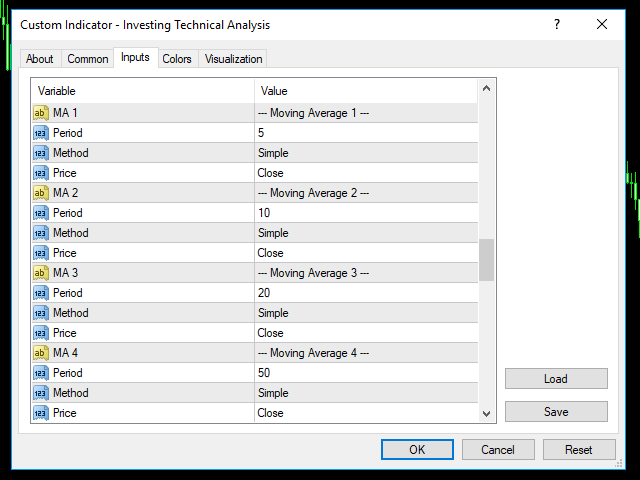
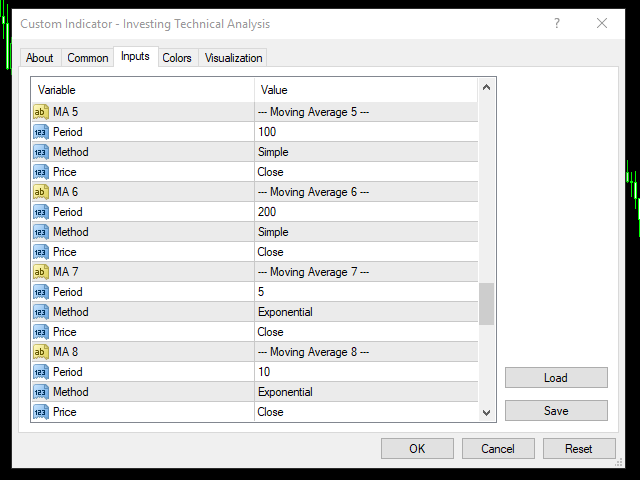
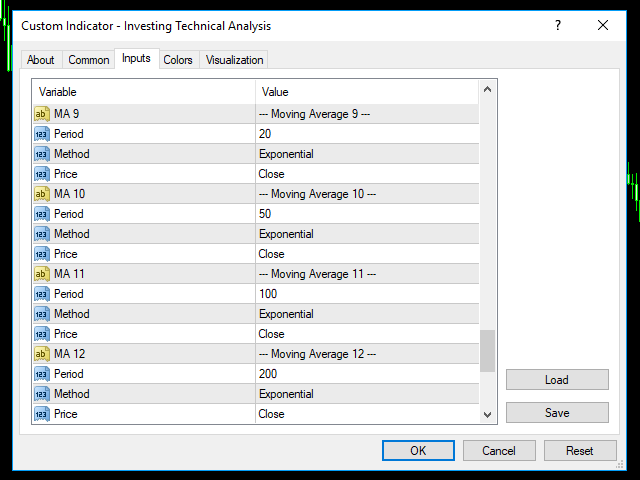
- Medias móviles
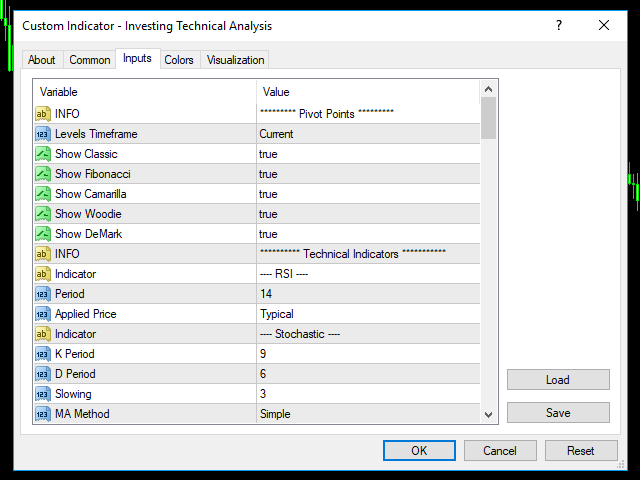
Lospuntos pivote se calculan utilizando cinco métodos diferentes:
- Clásico
- Fibonacci
- Camarilla
- Woodie
- DeMark
Con el indicador técnico, puede encontrar las señales de trading utilizando la combinación de diferentes indicadores. Soporta los siguientes indicadores técnicos:
- RSI
- Estocástico
- Estocástico RSI
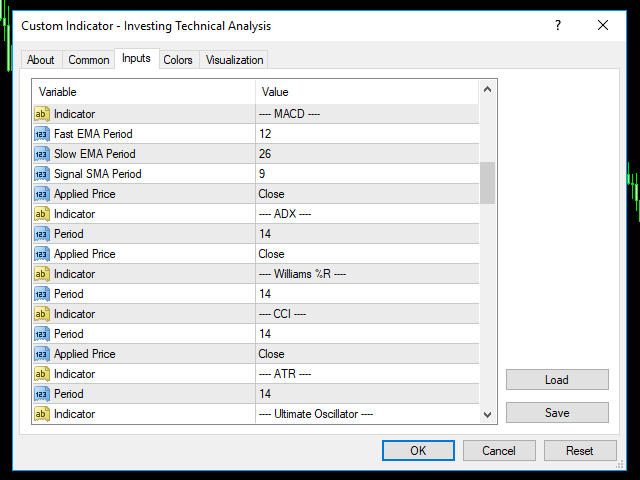
- MACD
- ADX
- CCI
- ATR
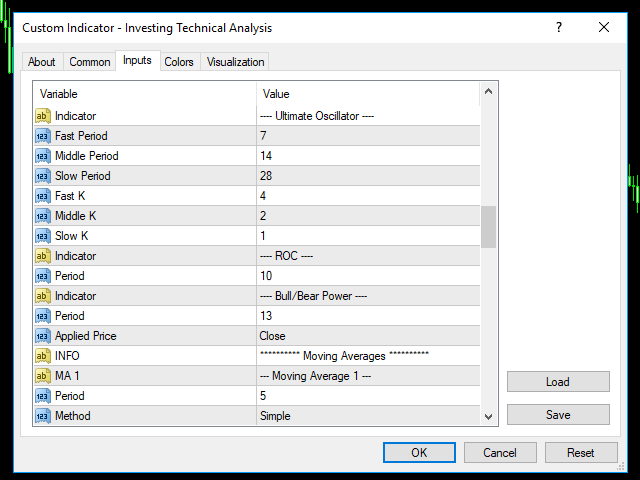
- Oscilador último
- ROC
- Potencia alcista/bajista
Las Medias Móviles se utilizan para encontrar la dirección de la tendencia utilizando múltiples indicadores de Medias Móviles. Se calcula utilizando las siguientes reglas:
-Ask < MA, es VENTA
-Oferta > MA, es COMPRA
-Ask > MA > Bid, es None (sin señal)
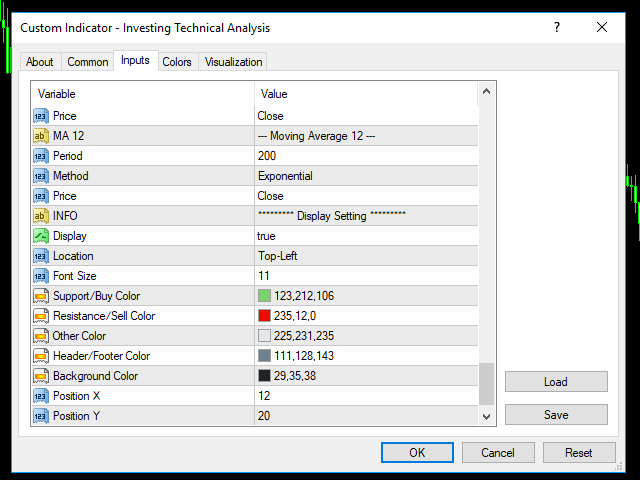
Después de conectar el indicador a un gráfico, mostrará la siguiente información en el gráfico:
- Niveles de los puntos de giro
- Indicadores técnicos, sus valores y la señal generada a partir de ellos.
- Recuento de compras y ventas
- Resumen: Conclusión
- Múltiples MA ordenadas por su método
- Recuento de compra y venta
- Resumen: Conclusión
Puede ocultar toda la información mostrada en el gráfico estableciendo false en Display on Display Setting.