Technical Analysis Ind
- Indikatoren
- Version: 1.0
- Aktivierungen: 5
Mit dem Indikator Technische Analyse können Sie Handelssignale durch die Kombination verschiedener technischer Indikatoren finden. Er unterstützt die folgenden technischen Indikatoren:
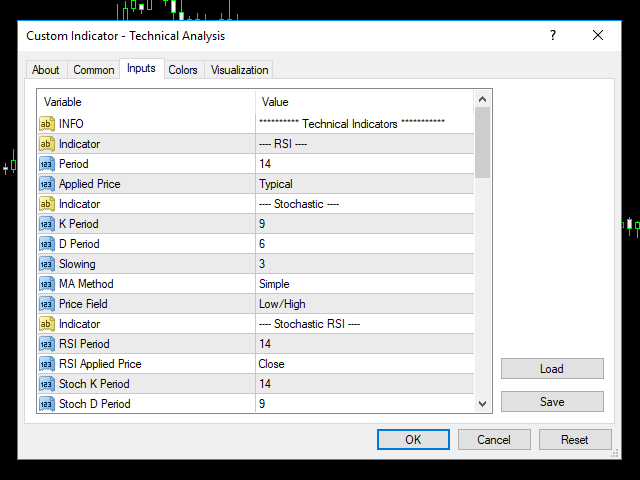
1. DERRSI
2.die Stochastik
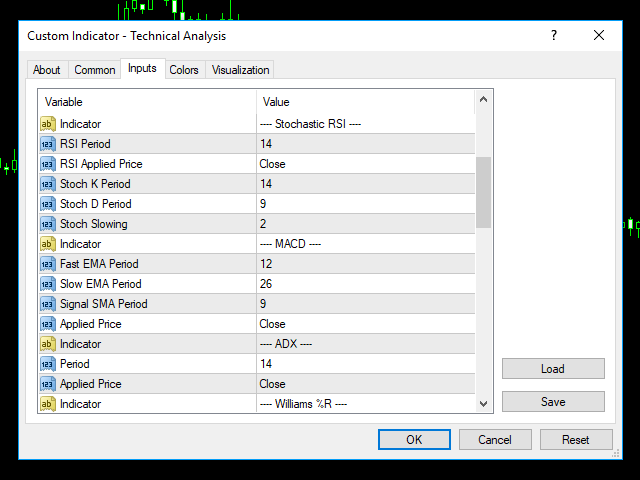
3.stochastischer RSI
4.MACD
5.DER ADX
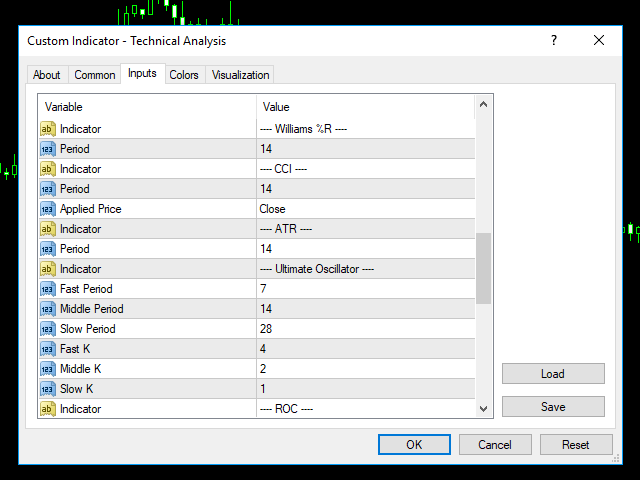
6. DERCCI
7ATR
8.ultimativer Oszillator
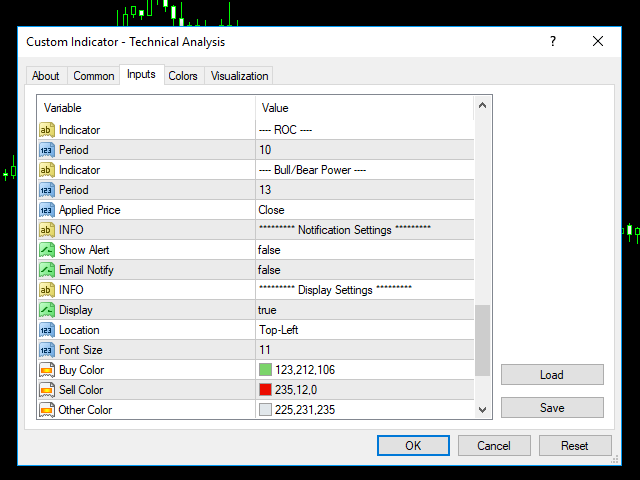
9ROC
10Bull/Bear Power
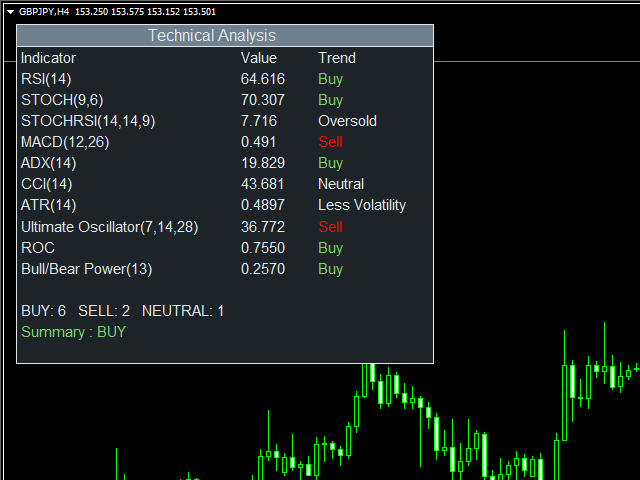
Nachdem Sie den Indikator an ein Diagramm angehängt haben, werden die folgenden Informationen auf dem Diagramm angezeigt:
1. dietechnischen Indikatoren, ihre Werte und das von ihnen erzeugte Signal.
2. dieAnzahl der Käufe und Verkäufe
- Zusammenfassung: Schlussfolgerung