Bulls MACD MT5
- Indikatoren
- Version: 2.5
- Aktualisiert: 19 November 2021
- Aktivierungen: 5

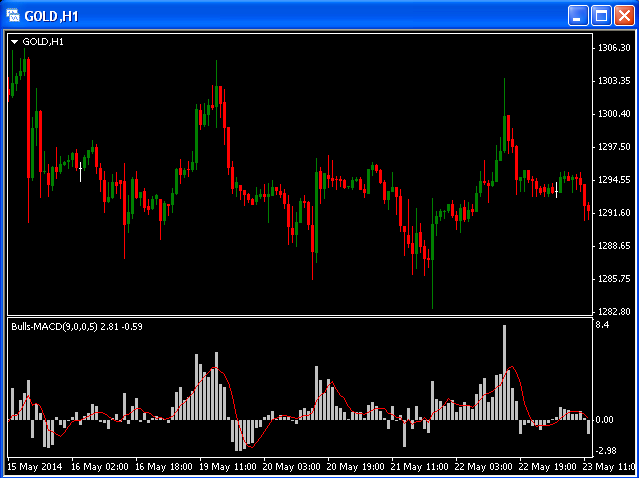
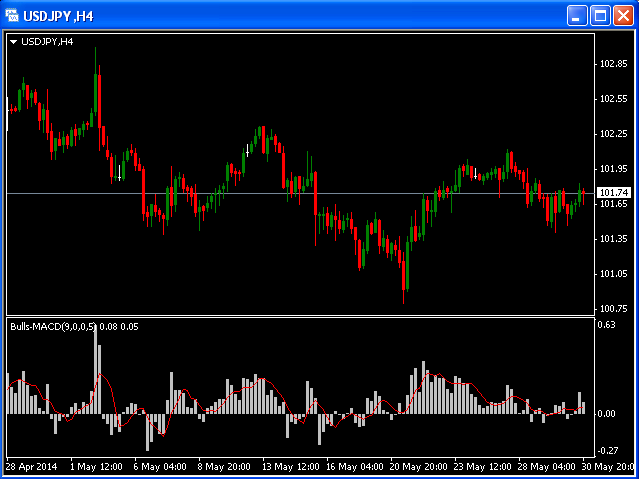
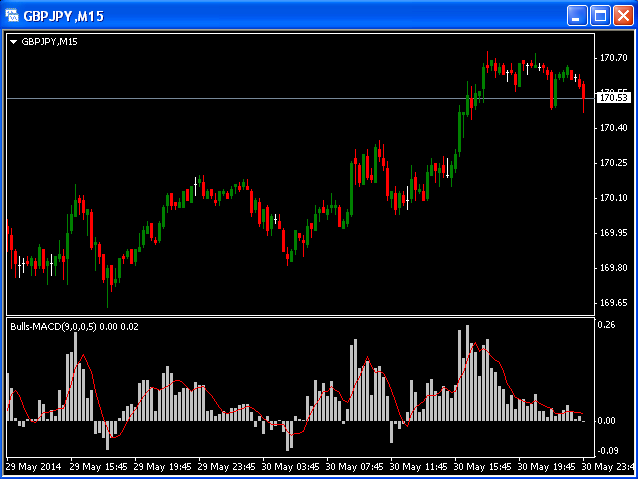
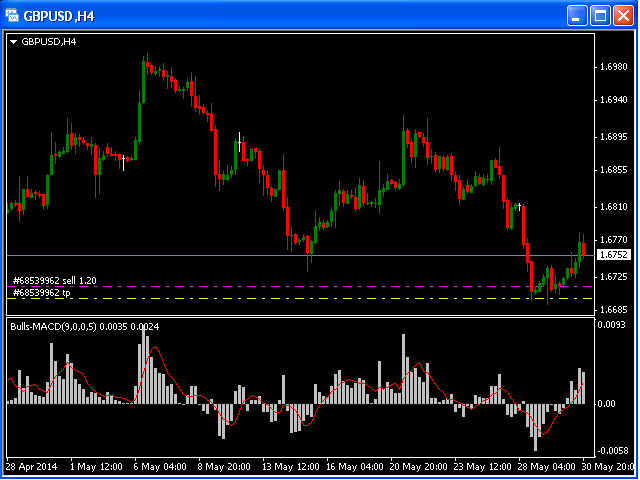
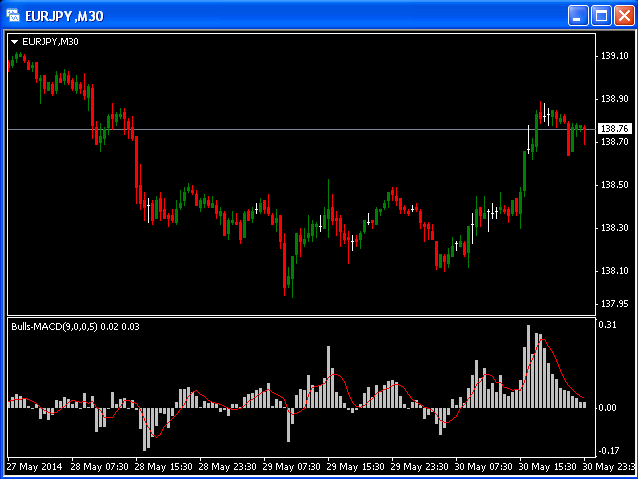
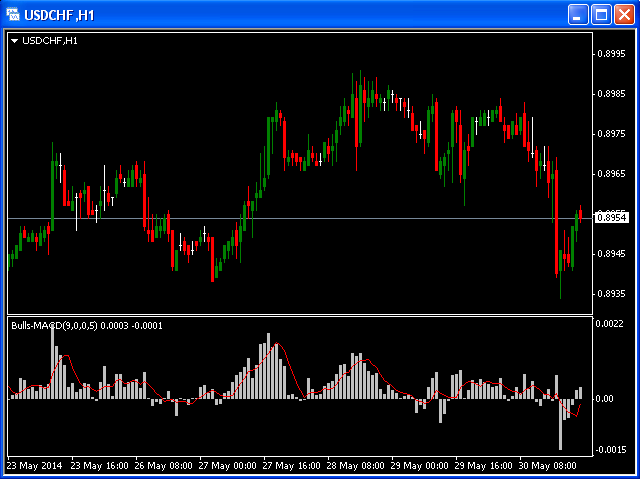
Dieser Indikator ist eine visuelle Kombination von 2 klassischen Indikatoren: Bulls und MACD.
Die Verwendung dieses Indikators kann die gleiche sein wie die der beiden klassischen Indikatoren einzeln oder kombiniert.
Eingabeparameter:
- BearsPeriod = 9;
- ENUM_MA_METHOD maMethod = MODE_SMA;
- ENUM_APPLIED_PRICE maPrice = PRICE_CLOSE;
- SignalPeriod = 5.