FVG Imbalance Zones
- Indikatoren
- Version: 1.0
- Aktivierungen: 5
Beschreibung des Indikators: FVG Ungleichgewichtszonen
Der FVG Imbalance Zones-Indikator ist ein leistungsfähiges Instrument zur Erkennung potenzieller Kursungleichgewichte auf Finanzcharts. Dieser innovative Indikator wurde von Pierre-Alexis Blond entwickelt und markiert Regionen, in denen signifikante Preisverschiebungen auftreten können. Er bietet Händlern wertvolle Einblicke in potenzielle Wendepunkte des Marktes.
Hauptmerkmale:
-
Erkennung von Ungleichgewichten: FVG Imbalance Zones identifiziert potenzielle Preisungleichgewichte auf dem Markt und zeigt Bereiche auf, in denen Angebot und Nachfrage erheblich auseinanderklaffen können. Diese Zonen sind entscheidend für das Verständnis potenzieller Umkehrungen und Ausbrüche.
-
Anpassbare Parameter: Händler können die Fenstergröße leicht an ihren bevorzugten Analysezeitrahmen anpassen. Der Indikator bietet Flexibilität bei der Wahl des optimalen Zeitfensters für das Scannen von Marktdaten.
-
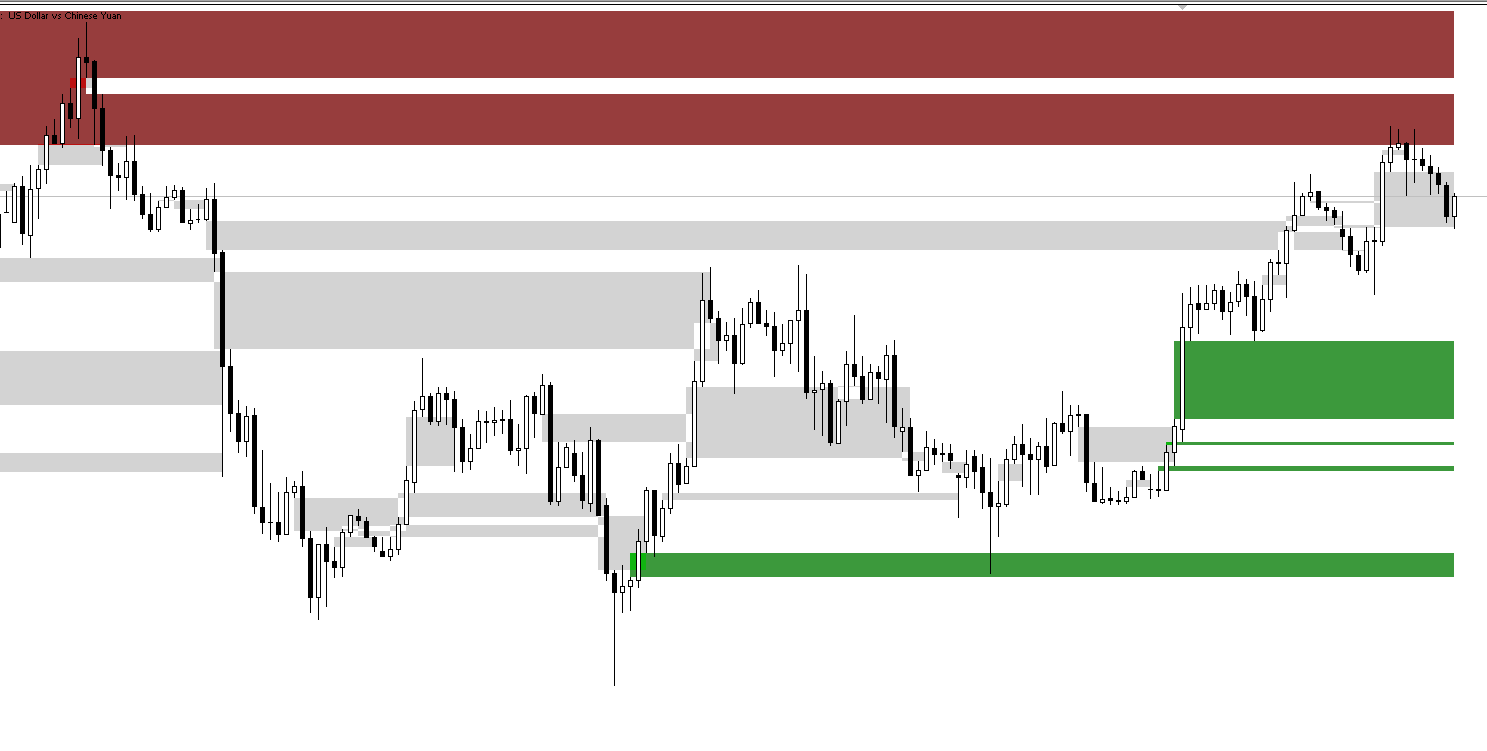
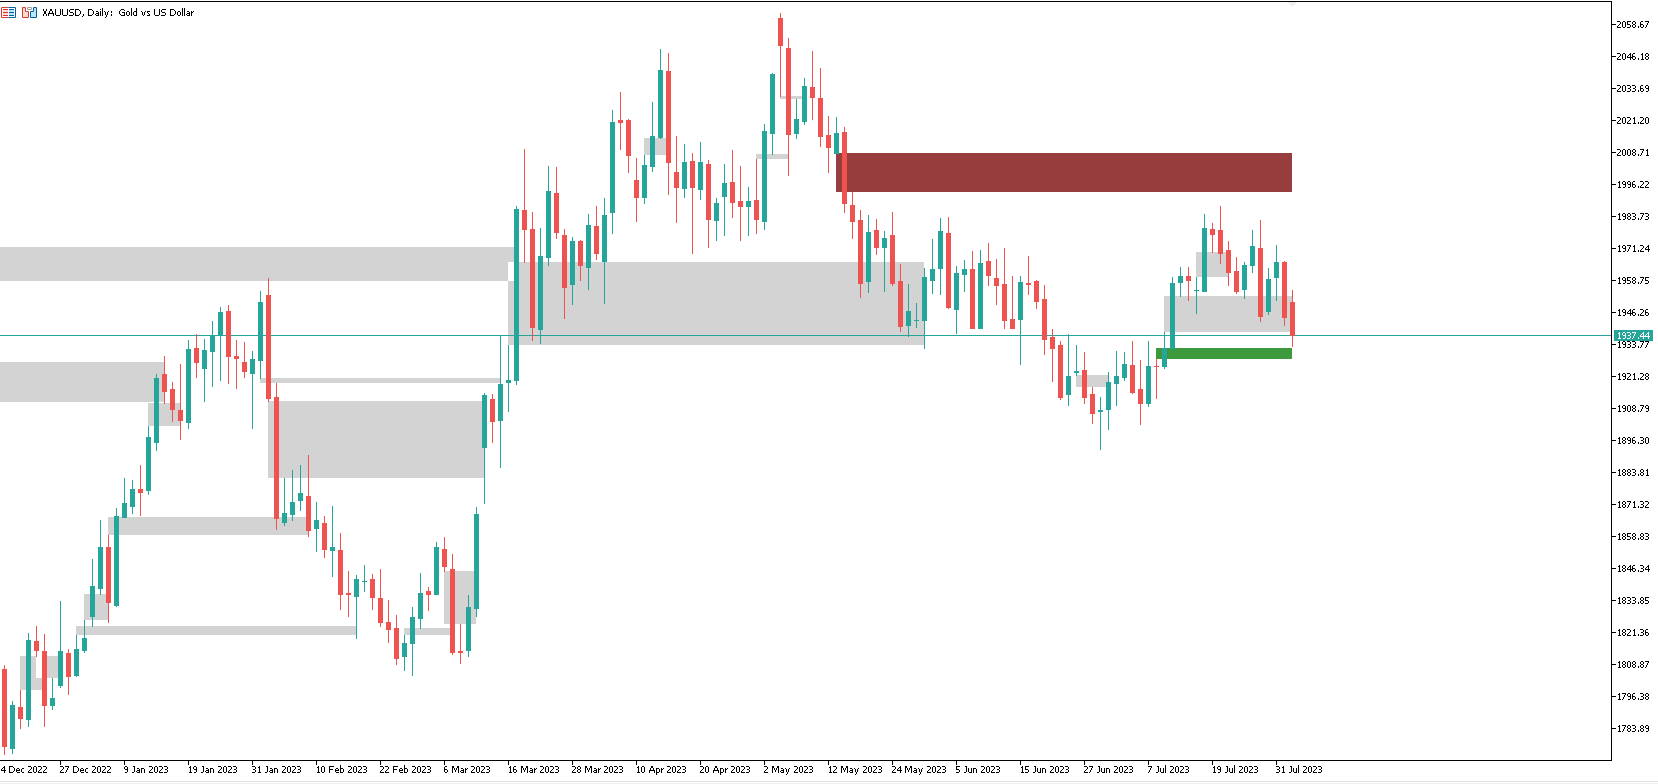
Visuelle Darstellung: Der Indikator zeichnet Rechtecke direkt auf das Preisdiagramm, wodurch die identifizierten Ungleichgewichtszonen deutlich hervorgehoben werden. Diese Rechtecke sind farblich kodiert, um bestätigte Ungleichgewichte anzuzeigen und Händlern zu helfen, schnellere und fundierte Entscheidungen zu treffen.
-
Benutzerfreundliches Interface: Dank der benutzerfreundlichen Oberfläche können Händler die relevanten Informationen schnell erfassen und sich so auf Handelsstrategien und Marktchancen konzentrieren.
-
Dynamische Aktualisierungen: FVG Imbalance Zones wird laufend aktualisiert, sobald neue Kursdaten eintreffen. Damit wird sichergestellt, dass die Händler Zugang zu Echtzeit-Informationen haben und über die Marktentwicklungen auf dem Laufenden bleiben.
Wie Sie FVG Imbalance Zones verwenden:
-
Imbalance-Zonen identifizieren: Achten Sie auf Rechtecke im Chart, die potenzielle Ungleichgewichtszonen darstellen. Grüne Rechtecke weisen auf Ungleichgewichte nach oben hin, während rote Rechtecke auf Ungleichgewichte nach unten hinweisen.
-
Bestätigungssignale: Achten Sie auf gefüllte Rechtecke, die auf bestätigte Ungleichgewichte hinweisen. Diese Zonen können als zuverlässige Preisumkehr- oder Ausbruchsbereiche dienen.
-
Fenstergröße anpassen: Passen Sie die Fenstergröße des Indikators an den von Ihnen bevorzugten Analysezeitrahmen an, sei es für den Intraday-Handel oder für längerfristige Strategien.
-
Kombinierbar mit anderen Indikatoren: Die FVG Imbalance Zones können effektiv in Verbindung mit anderen technischen Indikatoren verwendet werden, um robuste Handelsstrategien zu entwickeln.
Der FVG Imbalance Zones-Indikator bietet eine einzigartige Perspektive auf die Marktdynamik und ermöglicht Händlern einen rechtzeitigen Einblick in potenzielle Kursbewegungen. Durch das frühzeitige Erkennen potenzieller Ungleichgewichte können Händler fundierte Entscheidungen treffen und so ihren Handelserfolg und das allgemeine Marktverständnis verbessern. Erleben Sie die Macht der FVG Imbalance Zones und bringen Sie Ihren Handel auf neue Höhen.