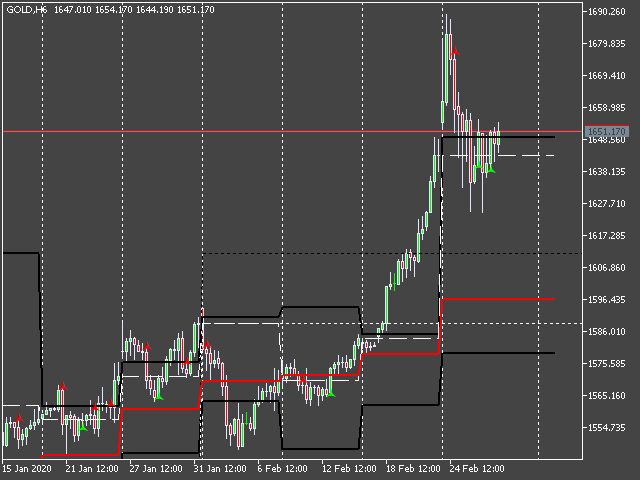
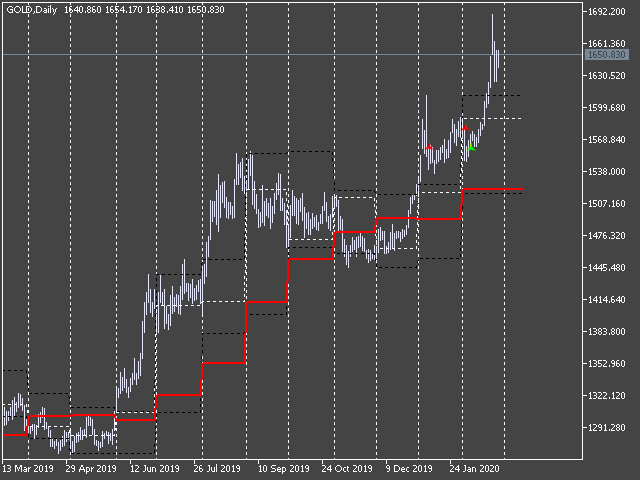
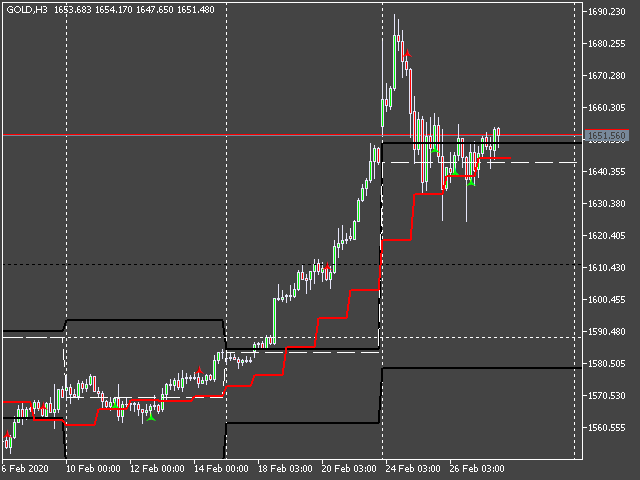
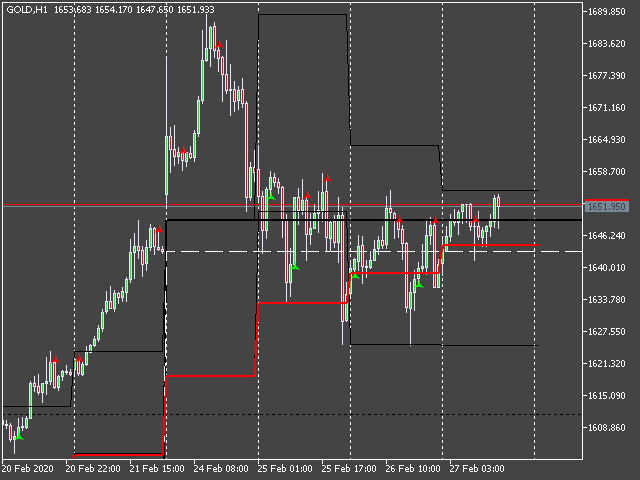
Sentiment Liner
- Indikatoren
- Zoltan Nemet
- Version: 1.11
- Aktivierungen: 5
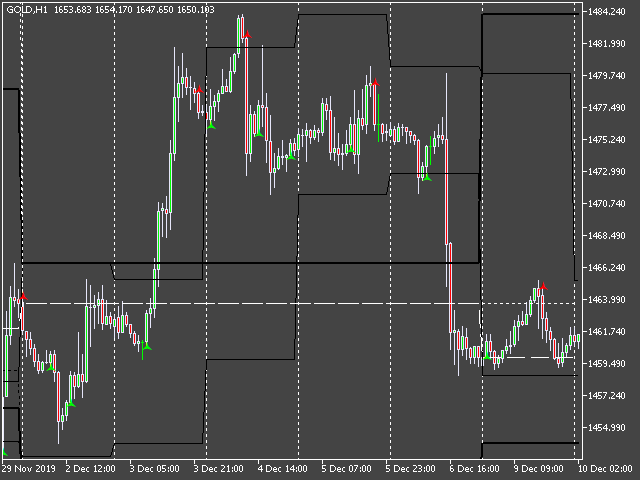
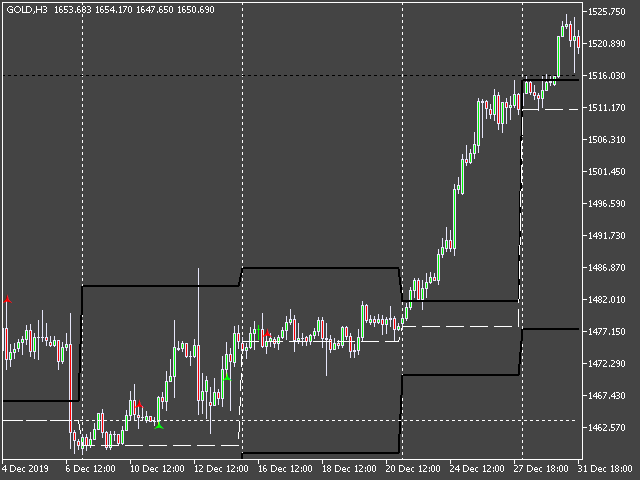
Sentiment Liner Dies ist ein steroidisierter täglich-schwach-monatlicher Hoch-Tief- und Eröffnungsindikator, der nicht fehlen darf. Damit kann der Benutzer den Durchschnitt der (täglich-schwach-monatlichen) Eröffnungswerte ermitteln. 4 Beispiel: Wenn Sie im Tagesmodus den Durchschnitt auf 5 stellen, erhalten Sie das 5-Tage-Sentiment. Im schwachen Modus schalten Sie den Durchschnitt auf 4, dann erhalten Sie das 4 schwache Sentiment,...und so weiter. Natürlich kann man als einfachen Tag-Woche-Monat Hoch- und Tiefindikator verwenden. S1: Hoch S2: Tief Pivot: offen, Durchschnitt: Mittelwert