RSI Scanner with Alerts MT5
- Indikatoren
- Version: 1.0
- Aktivierungen: 5
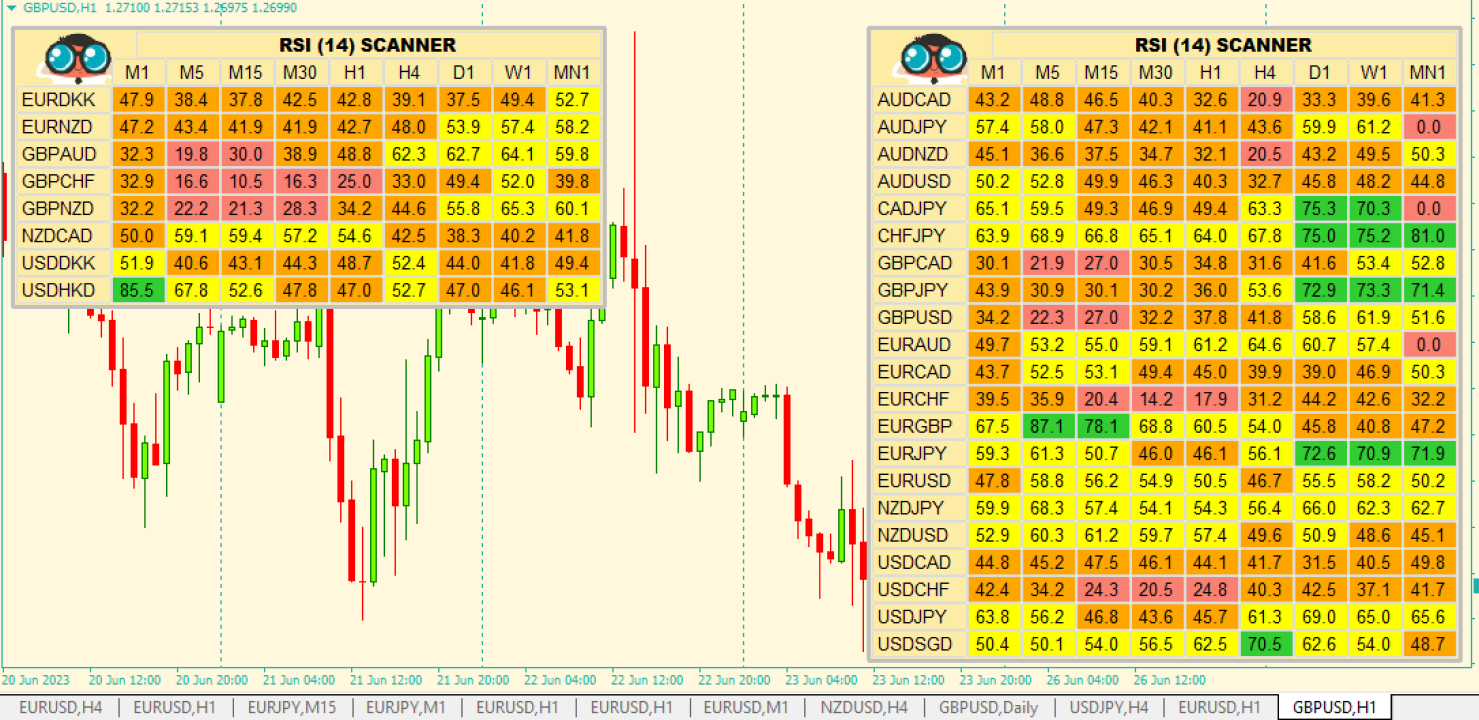
Ein nützlicher Scanner/Dashboard, der die RSI-Werte für mehrere Symbole und Zeitrahmen anzeigt.
Er kann mit einem einfachen Klick auf den Scanner-Mann oben links im Dashboard ein- und ausgeblendet werden.
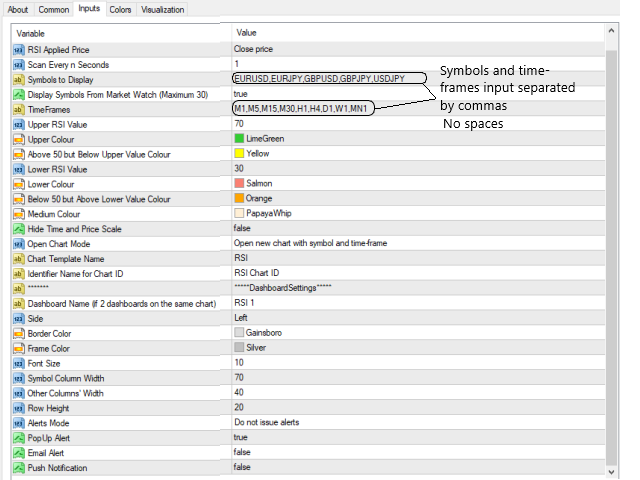
Sie können obere und untere RSI-Werte eingeben, und die Farben können so eingestellt werden, dass sie angezeigt werden, wenn diese Werte über/unterschritten werden. Die Standardwerte sind 70 und 30.
Es gibt auch Eingabefarben für den Fall, dass der RSI über oder unter 50 liegt (aber die oberen/unteren Werte nicht überschreitet).
Symbole und Zeitspannen werden durch Kommas getrennt eingegeben.
Die Symbole können auch aus dem Fenster Market Watch geladen werden. Wenn es mehr als 30 Symbole gibt, werden nur die ersten 30 geladen.
Sie können wählen, ob das Dashboard auf der rechten oder linken Seite des Charts angezeigt werden soll.
Wenn Sie 2 Dashboards auf demselben Chart haben möchten, müssen Sie für jedes einen anderen Namen eingeben.
Der Scan ist auf einen Timer eingestellt und wird standardmäßig alle 1 Sekunde durchgeführt. Sie können in den Eingaben einen anderen Zeitraum einstellen.
Wichtig
Ich empfehle Ihnen, dieses Dashboard nur mit Symbolen und Zeitrahmen zu verwenden, mit denen Sie normalerweise arbeiten.
Die iCustom-Handles werden bei der Initialisierung eingerichtet, und das kann ein Problem sein, wenn die Historie für das Symbol und den Zeitrahmen nicht auf dem neuesten Stand ist.
In diesem Fall wird der Indikator nicht initialisiert und Sie müssen ihn neu starten.
Auf der Registerkarte Experten wird ein Bericht für das Symbol und den Zeitrahmen angezeigt, für die das Abrufen des Handles fehlgeschlagen ist.
Wenn das Abrufen des Handles für dasselbe Symbol immer wieder fehlschlägt, sollten Sie den Chart öffnen und überprüfen, ob genügend Historie vorhanden ist. Falls nicht, löschen Sie das Symbol aus der Liste.
ALERTS
Sie können das Programm so einstellen, dass es Warnungen ausgibt, wenn die oberen oder unteren Levels erreicht werden.
Intra-Bar-Warnungen werden auf der Grundlage des RSI-Werts des letzten geschlossenen Balkens und des aktuellen RSI-Werts ausgelöst.
Wenn z.B. der RSI-Wert des letzten geschlossenen Balkens unter dem oberen RSI-Niveau liegt und der aktuelle RSI-Wert das obere Niveau erreicht, wird ein Alarm ausgelöst.
Es wird nur ein Alarm pro Bar ausgegeben.
Alarme für geschlossene Balken werden normalerweise nur ausgelöst, wenn ein Balken gerade geschlossen wurde, und basieren auf dem gerade geschlossenen Balken und dem davor liegenden Balken.
Wenn z.B. der RSI des gerade geschlossenen Balkens über dem oberen Niveau liegt und der diesem RSI-Wert vorausgehende Balken unter dem oberen Niveau liegt, wird ein Alarm ausgegeben.
Wenn der Scanner gestartet wird, erhalten Sie möglicherweise zunächst zusätzliche Warnungen, während er aktualisiert wird.
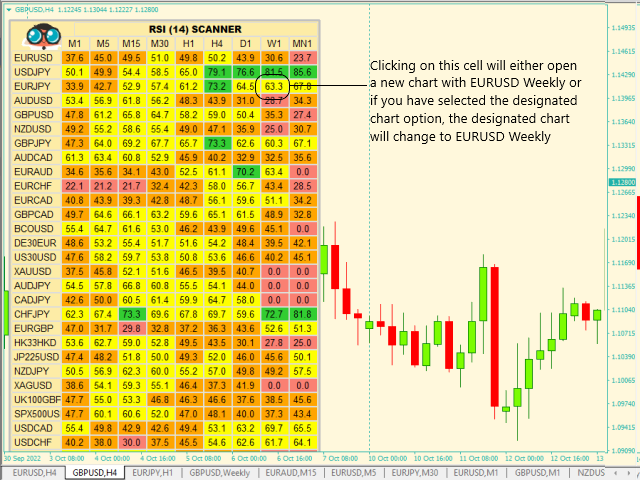
Sie können eine Chartvorlage einrichten und sie "RSI" nennen (oder wie immer Sie wollen und die Eingabe ändern).
Wenn Sie also an EURUSD M15 interessiert sind, klicken Sie einfach auf die entsprechende Zelle (gegenüber von EURUSD und unter M15), und es öffnet sich ein neues Diagramm für EURUSD M15 mit der angewendeten Vorlage "RSI".
Es ist nicht empfehlenswert, dass die Vorlage auch den Scanner enthält, sondern nur den RSI-Indikator und alles andere, was Sie benötigen.
Wenn Sie es vorziehen, können Sie ein bereits geöffnetes Diagramm bestimmen, und anstatt ein neues Diagramm zu öffnen, werden das Symbol und der Zeitrahmen automatisch auf das bestimmte Diagramm gesetzt.
Um diese Funktion nutzen zu können, muss der Indikator die Chart-ID für den bezeichneten Chart kennen. Schicken Sie mir eine Nachricht und ich sende Ihnen das Skript, um die Chart ID zu erhalten (kann hier nicht angehängt werden)
Beim Laden des Skripts müssen Sie nur die Kennung des Charts eingeben (z.B. "RSI Chart ID") und die Chart ID wird in einer Datei gespeichert. Geben Sie denselben Bezeichner in den Indikator ein, damit dieser den Chart finden kann.
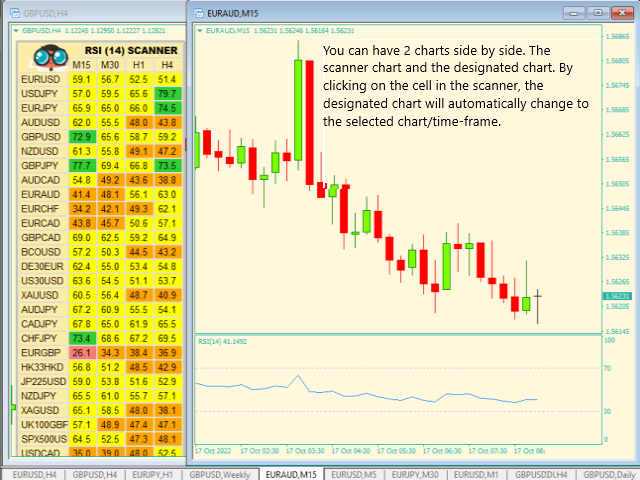
Manche Händler bevorzugen es, 2 Charts nebeneinander zu öffnen, einen für das Dasboard und einen für den designierten Chart. In diesem Fall sollten Sie die Tine- und Preisskalen ausblenden.
Sie können dies mit der Eingabe "Zeit- und Preisskala ausblenden" auf true/false setzen.
Bitte beachten Sie, dass die Demoversion einen eingeschränkten Funktionsumfang hat: Sie können die Aktualisierung der Werte auf dem Dashboard sehen und die Alerts werden nicht angezeigt, sondern im Journal ausgedruckt.
Die Testversion unterstützt nicht das Öffnen zusätzlicher Charts durch Anklicken der Zellen.