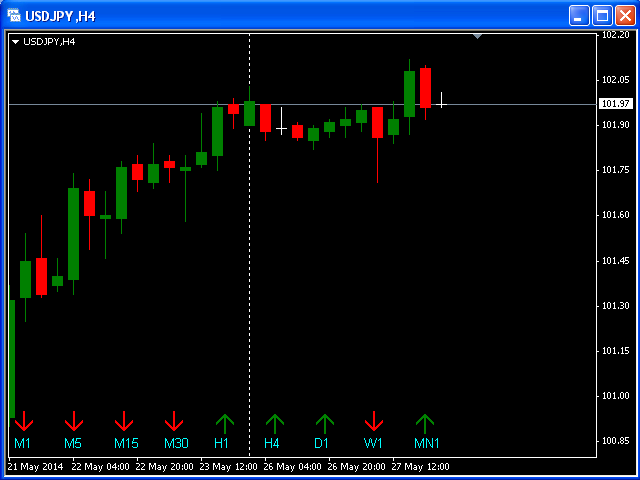
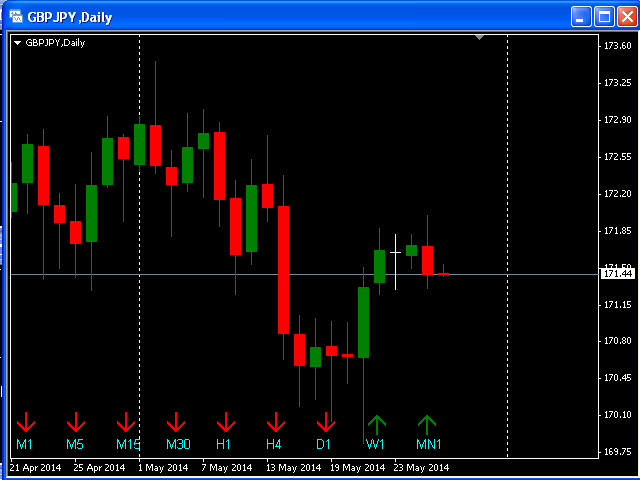
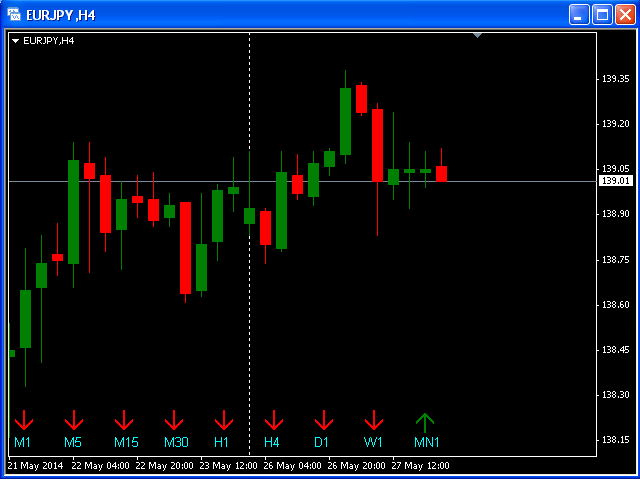
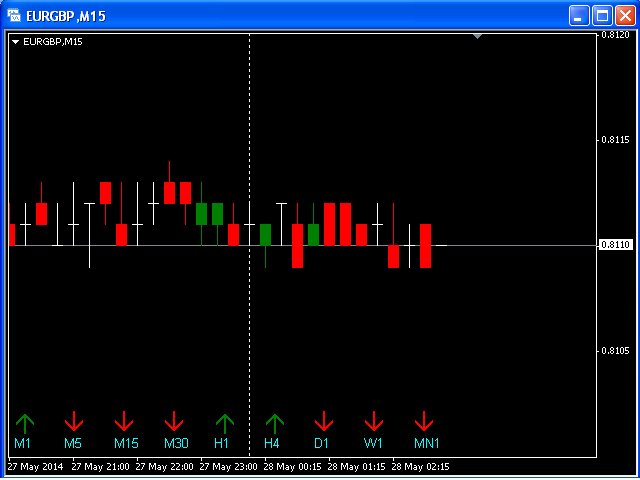
Majoritarian MT4 Indicator
- Indikatoren
- Version: 1.7
- Aktualisiert: 20 April 2020
- Aktivierungen: 5

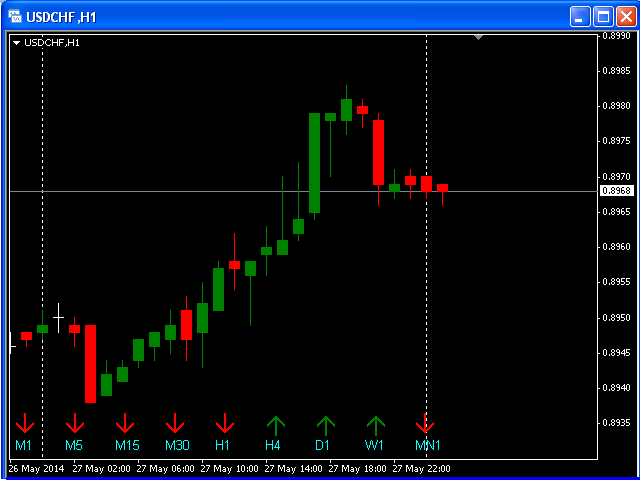
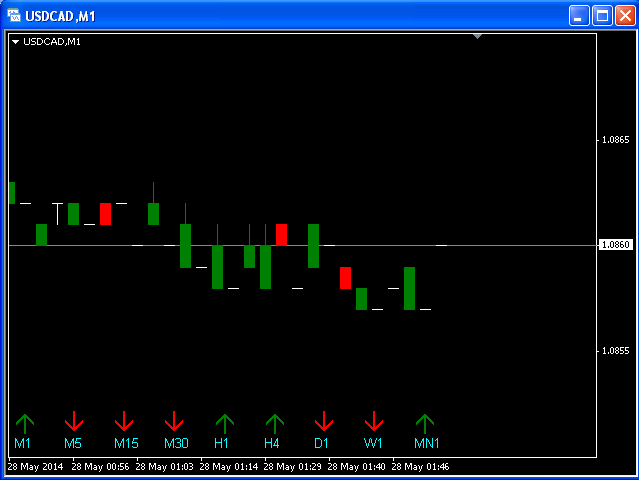
Dieser Indikator verwendet 10 klassische Indikatoren:
- Gleitende Durchschnitte
- Larry Williams' prozentuale Spanne
- Parabolischer Stopp und Umkehr
- Gleitende Durchschnitte Konvergenz/Divergenz
- Gleitender Durchschnitt des Oszillators
- Rohstoff-Kanal-Index
- Momentum
- Relative Stärke-Index
- Stochastischer Oszillator
- Durchschnittlicher direktionaler Bewegungsindex
zur Berechnung des Auf- oder Abwärtstrends für das aktuelle Währungspaar nach dem Majoritätsprinzip für alle TimeFrames.