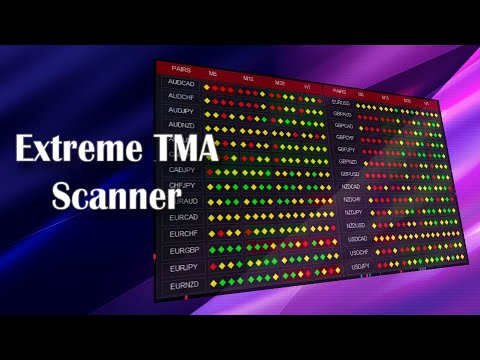
Abiroid Extreme TMA System Scanner Dashboard

5

This Scanner Dashboard uses the Extreme TMA System Arrows Indicator to show good BUY/SELL signals.

This Product contains dashboard only. It does not contain the Abiroid_Arrow_Extreme_TMA.ex4 indicator.

Arrows indicator is not necessary for dashboard to work. 

To see arrows, you can buy the arrows indicator separately if you like:

https://www.mql5.com/en/market/product/44822


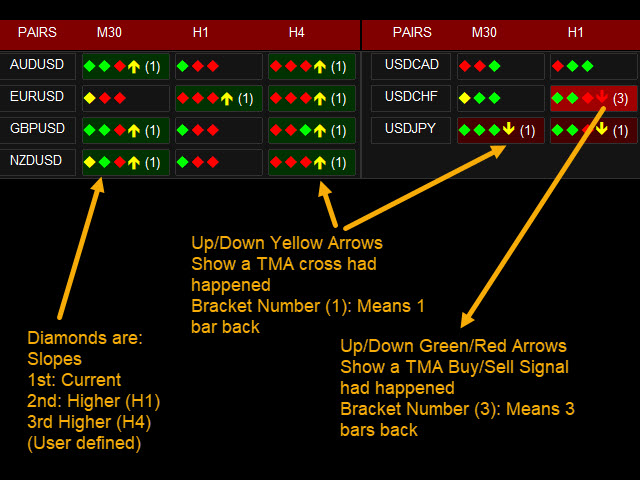
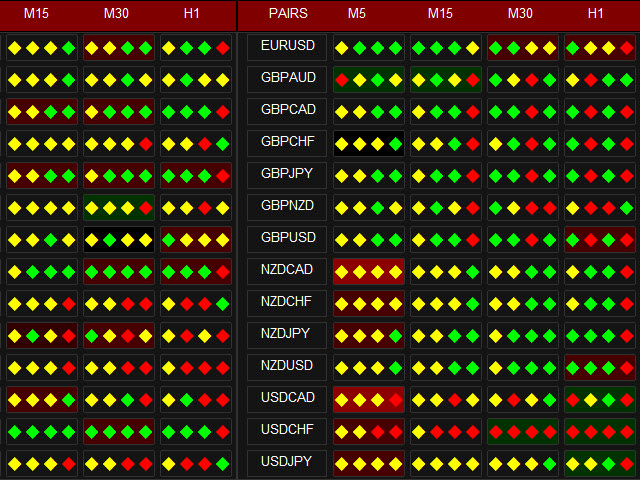
Dash shows Slopes for current and Higher Timeframes.

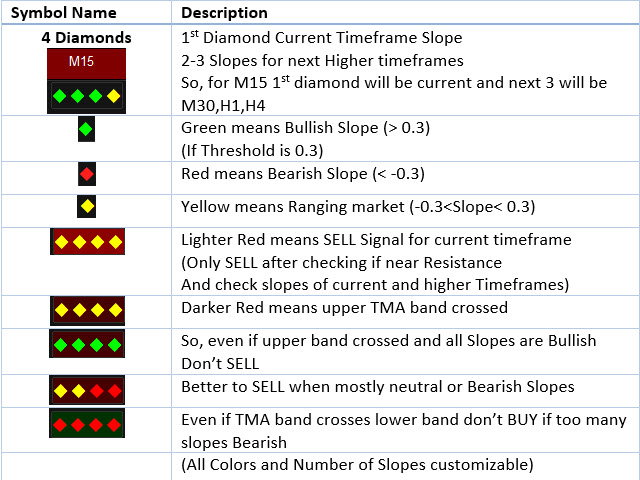
- 1st diamond is current TF. Next diamonds are higher TFs

(Please Note: Slope Calculation uses ATR and TMA for several past bars. So, having too many slopes for many pairs and timeframes might make dashboard slow.

e.g: Having 4 slopes for 28 pairs for 4 TFs will make dashboard load in about 30-40 seconds depending on your PC.)

- Last Arrow is TMA Signal:

Yellow arrow: Price Crossed up or down TMA band

Red/Green arrow: price reversing making lower lows (SELL) or higher highs (BUY) from previous bar

- Bracket shows number of bars back where Signal happened.

BG Dark Green: price below lower band and reversing.

BG Dark Red: price above upper band and reversing.

When BUY/SELL signal occurs, block turns Green/Red.


BUY/SELL:


- If useHeikenAshiPrice is true – use Heiken pricesIf Price has crossed Upper/Lower bands
- If useRSI is true and Price OverBought/OverSold
- If checkCurrentTFSlope or checkHTFSlope – do a Slope Check as described in next section
- If “Ignore If TakeProfit Too Close” is true – and price less than “Min Distance from TakeProfit” percentage.

If all conditions match, get a BUY or SELL Signal and Alert. BUY is Green BG. SELL is Red BG.

Channels Check:

TMATrue (Non-repaint)

FastLineTMA (Repaints) From original Extreme TMA Strategy

TMA+CG (Repaints) 

TMA+CG is a bit slower than others - so might take longer to load when using multiple pairs/timeframes

Slope Check:

Options:

Slope1 (repaints)

Slope2 (Non-repaint)

If SlopeThreshold is 0.3.

Slope < -0.3 means Bearish. Show only SELL Signals.
Slope > 0.3 means Bullish. Show only BUY Signals.
Slope between -0.3 and 0.3 means Market is Ranging. Show both BUY and SELL Signals

Take Profit Distance Calculation:

MinDistance is 0.3 means 30%

100% distance is between Upper/Lower band and Middle band.
Distance between Upper/Lower band and starting price is already more than 30% then ignore the signal.
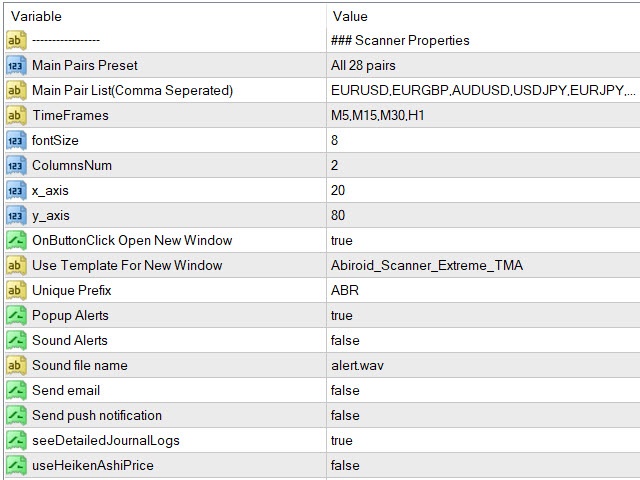
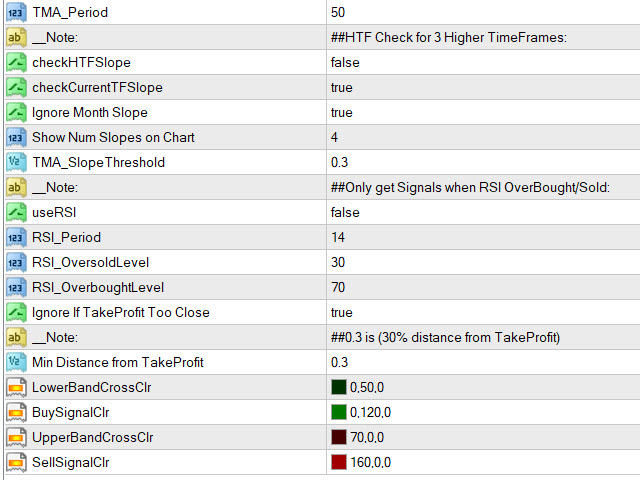

Indicator Settings:

Read Detailed dashboard settings here:

- TMA_Period = 50 (Triangular Moving Average Period)
- ATR_Period = 100
- ATR Multiplier or Bands Deviation (move channels closer or further)

- checkHTFSlope = false (Check Slopes for next 3 Higher TF)
- checkCurrentTFSlope = true (Check slope for Current TF)
- ignoreMNSlope = true (Ignore Monthly slope or not)

- TMA_SlopeThreshold = 0.3 (Slope Threshold for Checking Bullish/Bearish)

- useRSI = false (If Use RSI true – only trade BUY if RSI OverSold and SELL if RSI OverBought)
- RSI_Period = 14
- RSI_OversoldLevel = 30

- RSI_OverboughtLevel = 70

- ignoreTooCloseMiddleBand = true (TakeProfit will be somewhere close to Middle Band. Price reached too close to middle band - ignore signal)

- minDistFromMiddleBand = 0.3 (0.3 means 30% distance from Middle Band. If ignoreTooCloseMiddleBand  true and price reaches more than 30% distance from middle band then ignore signal)

- Past Bars Search For TMA Signal: Past bars for TMA Cross or Up/Down Signal


"Do Past Arrow Search At Start" if true, it will look at specified PastBars when dash first loads and will show which arrow was last. If false, it will only study new bars and update arrow values in brackets as and when they occur.

If "Do Past Arrow Search At Start" true and "Past Bars Search For TMA Signal" is a high number can slow down the dashboard.

Suggestion: If you want to look at a lot of past bars, keep this false. And only look for new bars.

Arrow (number): No of bars back a cross had occurred.

Arrow (+): price is still outside the TMA bands. So lookback further.

Reviews 6
Andreas Door
76
Andreas Door 2023.04.17 20:52 
 

Very good dashboard. Individually adaptable to your own special needs. These trading signals to the mobile phone save countless hours in front of the computer. Very good product! Very good price.

Giuseppe Del
33
Giuseppe Del 2022.08.10 21:00 
 

it is PERFECT!!!

Paulina Andrea Madariaga Figueroa
4202
Paulina Andrea Madariaga Figueroa 2021.02.26 15:01 
 

I don't understand how this indicator is not so popular. All of this author's products are fantastic.

Recommended products
Knowledge of the strength and weakness of each currency is vital for every forex trader. Our   Currency Strength Meter indicator   measures the strength of eight major currencies (USD, EUR, GBP, CHF, JPY, CAD, AUD, NZD) by using the Relative Strength Index indicator, also known as RSI. The Currency Strength Meter indicator shows you, simply and quickly, when a currency is oversold, overbought, or in "normal area". This way, you can identify which currency is the strongest and the weakest. Our
Все трейдеры знают, что без статистики работать нельзя и ведут статистику на бумаге или используют интернет ресурсы. Индикатор "VG-Statistics" создает статистику по истории Ваших сделок. Для правильной работы нужно выбрать нужный период в истории сделок и нажать кнопку "Развернуть" в левом углу графика, по умолчанию будут подсчитаны все сделки загруженные в ваш терминал с учетом комиссии и свопа, для подсчета например только "EURUSD" установите индикатор на график "EURUSD" и в настройках изменит
As the suggested, with this indicator you are able to switch from one symbol or timeframe to another in the same single chart. So forget about opening tons of chart on your screen! It's not designed for ICT or SMC trader, but if you are that kind of trader you still can use it. Imagine you have a strategy containing various indicators and settings, on a single chart you can screen the entry opportunity then move to the next symbol or timeframe.  
FREE
Shadow System Candles - AI Trend Visualization Concept "Stop trading in the dark. Equip your chart with Night Vision." Shadow System Candles is the visual core of the "Shadow Operation" project. It eliminates market noise and visualizes the true direction of the trend using AI-based logic (ADX + MA integration). Note: This tool does not generate buy/sell arrows. It is designed to train your eyes to recognize "Active Trends" and "Dangerous Ranges. Key Features ・AI Logic Coloring[/b]: Automat
FREE
The Trend Champion indicator works on all timeframes and currency pairs. The indicator should be used as an auxiliary tool for technical analysis, it helps to determine the direction of the trend: either upward or downward price movement for a particular currency pair. Can be used along with oscillators as filters. Trend Champion is a trend indicator. Arrows indicate favorable moments and directions for entering the market. The indicator can be used both for pipsing on small periods and for lo
Symbols Spread panel
Andrii Miknevich
5 (1)
An indicator in the form of a panel for collecting statistics on spreads from a specified list of pairs. It is enough to open one chart and set an indicator to collect statistics for all specified pairs. After completion of work, the panel writes values to a file, which allows not to interrupt statistics after completion of work. Input parameters: -Interval to update the spread for pairs (sec) Allows you to specify how often to collect statistics (allows you to reduce the load) -List of pair
FREE
Hello, This is an easy symbol change panel. The free version only can change major pairs which are "AUDUSD, EURUSD, GBPUSD, USDCHF, USDCAD, USDJPY, NZDUSD" The full version can add your symbols. FULL version here: https://www.mql5.com/en/market/product/71176?source=Site+Market+MT4+Indicator+New+Rating005 Also, can change the TimeFrame as well. Symbols must be active on your Market Watch list. Parameters: ratio - change the size LineNumber - you can set that how many symbols are displa
FREE
Smart Currency Strength   is a powerful yet simple indicator that measures the strength of individual currencies. It features a graphic panel that lists the main currencies and their strength in each timeframe, ranging from 0 (most oversold) to 100 (most overbought). The strength for all currencies in the current timeframe is also shown in a separate window as a multi-line graph, where each currency is represented with a different color, this allows you to monitor the evolution of strength tre
Warning: Our product works with 28 symbols. The average accuracy level of the signals is 99%. We see signals below 15 pips as unsuccessful. Signal Watching   indicator is designed for signal trading. This indicator generates trend signals. It uses many algorithms and indicators to generate this signal. It tries to generate a signal from the points with the highest trend potential. This indicator is a complete trading product. This indicator does not need any additional indicators. The indic
The Commodity Channel Index(CCI) Multicurrency Scanner MT4 is a powerful indicator tailored for traders seeking to enhance their market analysis by monitoring multiple currency pairs simultaneously. With its advanced capabilities, this tool is ideal for forex traders who rely on the Commodity Channel Index to identify potential trading opportunities across various timeframes. This scanner provides a comprehensive overview of market conditions, helping traders make informed decisions based on rea
Price Matrix
Shellard Securities (Pty) Ltd
The dashboard indicator has been designed to quickly show the trader the price movements of various currency pairs.   The user is able to select 3 different timeframes to analyse. When the pip difference for each respective timeframe is either positive or negative, the pair block will be coloured green or red respectively. This allows the trader to view which timeframes are in agreement, as well as the pip movements therein.   A good visual tool to view multiple pairs and timeframes at once.   T
Indicator measures strength of each currency in your list. Main idea: It simply iterates through all combinations of pairs and adds difference between open and close in percent. Parameters: List of currencies - what currencies will be calculated (maximum is 8) Calculation type - from which data will be strength calculated Calculation data input - used as input related to calculation type Symbol suffix - used in case of suffix on symbols, e.g: when your symbols look like EURUSDm, EURUSDmicro etc
FREE
We stopped creatin small tools for MT4. Our focus are on MT5. Only very useful tools maybe we will develop to MT5. New Candle Alert is a simple indicator that notify you when a new candle is formed. You can modify the  notification message that will appear for you. The alarm sound is default by meta trader program. MT5 version:  https://www.mql5.com/pt/market/product/37986 Hope you enjoy it. Any doubt or suggestions please notify on private or by comments. See ya.
FREE
Swap Detector
Dustin Ricardo Pierenz
The Swap Detector is an essential MQL4 utility that displays the swap costs of any instrument when applied to a chart. It helps traders make informed decisions by visually indicating the swap value in customizable colors— green for positive (good) and red for negative (bad) by default. This tool ensures transparency in overnight holding costs, enabling better trade planning and risk management
FREE
BB PullBreak Signal F r e e Version Only Work on GBPUSD Pair.  Consider Buy Paid Version for ALL Pair Use This is an EA that can provide notifications when a candle breaks or a pullback or retrace occurs. This makes it very easy for us, especially those who are used to trading using Bollinger Bands. Usually we often experience missing signals from Bollinger Bands if we trade manually without the help of tools. This tool can provide notifications via email, telegram or MT4 mobile. You just need
FREE
MeeKiew Easy Order Manager (MT4) is a high-performance trading utility designed to streamline order execution and management on the MetaTrader 4 platform. Specifically optimized for use with the MeeKiew Dynamic MTF Pivot (MT4) indicator, this tool allows traders to react to market levels with speed and precision. While MT4 can sometimes feel slower in manual execution, this manager bridges the gap with a "One-Click" philosophy and advanced bulk management features. MeeKiew Dynamic MTF Pivot (MT4
FREE
This indicator is one of the useful tools for traders who trade on currency pairs and based on the strength of each currency they can make a correct decision or confirmation in the positions.  It has been calculated for all the minor currency pairs supported by the broker and displays the values of the major currencies. These currencies are displayed horizontally or vertically according to the trader's config when executing the indicator. One of the trading strategies that can be used is to cho
FREE
Deal multiplier Mt4
Mikhail Mitin
4.46 (13)
The utility opens copies of open trades. It is very convenient if you use the Signals service and want to increase the volume of transactions. Settings: Symbols: all symbols only current symbol Orders: Buy Sell Magic Any Magic Input Magic Lot size Original - lot size from original order; Fix Lot - fix lot size (input); Lot X Mult - lot size X koef; Stop Loss From sender - Stop Loss from original; Without - without Stop Loss; Plus Fix - Stop Loss from original order + fix points; Fix Point - fix
FREE
The ultimate tool that every spread trader has been waiting for. This powerful MetaTrader indicator allows you to input any pair of instruments of your choice, offering you unprecedented flexibility in your trading strategies. Neither of the two instruments needs to be the symbol on which the indicator is placed, giving you total control over your analysis. What makes the Zero Based Spread Oscillator unique? Real Zero-Centered Oscillation : Unlike many other indicators available online, our osc
Price action finder
Siarhei Vashchylka
5 (5)
The Price Action Finder indicator is an indicator of entry points, which is designed to search and display patterns of the Price Action system on a price chart. The indicator is equipped with a system of trend filters, as well as a system of alerts and push notifications. Manual (Be sure to read before purchasing) | Version for MT5 Advantages 1. Patterns: Pin bar, Outside bar, Inside bar, PPR, Power bar, Hanging man, Inverted hammer 2. Pattern filtering system. Removes countertrend patterns from
Multi Timeframe Buy and Sell Power MT4 The Multi Timeframe Buy and Sell Power indicator for MetaTrader 4 is a versatile tool designed to provide traders with a clear visual representation of market pressure across nine standard timeframes, from M1 to MN1. By aggregating buy and sell strength percentages derived from recent price action and tick volume, it helps identify potential trends, reversals, and neutral conditions in real-time. The indicator displays this information in a compact dashbo
FREE
Ultimate ADX Multi-timeframe Indicator This indicator provides real-time ADX values for multiple timeframes in one unobtrusive label panel. It i s especially useful for gauging trend strength across timeframes without constantly switching charts. Choose which periods to display, anchor the panel to any chart corner, and color-code ADX strength levels to your taste. Key Features & Personalization Multi-Timeframe ADX - Toggle visibility for 9 built-in periods (M1, M5, M15, M30, H1, H4, D1, W1, MN1
FREE
FX-Support Presents the Trading Panel for MT4 The Trading Panel for MT4 is a powerful and versatile tool designed to assist traders in their daily trading activities. It helps traders open positions and identify market signals, such as ENG and STAR patterns. The panel simplifies decision-making and supports efficient trading. Key Features: Automatic Lot Size Calculation Calculates lot sizes accurately, considering market conditions and currency conversions for effective risk management. Accura
Are you tired of having many open charts and watching many different currency pairs? M‌CTSI will monitor the strengths of 56 currency pairs and show you the best pairs to trade, no more guessing which currency is stronger/weaker, no more trading a pair that is not moving positively. This is the BASIC version. MCTSIP is the more advanced version and can be found here: https://www.mql5.com/en/market/product/20994 You may have many charts open trying to determine the best currency pair to trade on
FREE
Hello, This is an easy symbol change panel. This is a full version of Symbol1 2Changer Symbols must be active on your Market Watch list. Parameters: SymbolList - you can add more symbols with a comma(,) ratio - change the size LineNumber - you can set that how many symbols are displayed per line. button_width - modify the button size button_height - modify the button size Thank you.
Waddah Attar Dashboard  Simple App show you the most important information about your account , trades and history . Risk , Quality and Performance are the most important numbers you must watch them carefully . also the important thing you must do is Focus on the RED Color on the board . you can control the font name , font size , width , height and padding properties . the information is auto arranged on the chart . don't worry about it . Thanks . recommended product for position risk manage
Fisher SC
Roman Lomaev
Attention, for the indicator to work correctly, you need to put the "MQL5" folder in your terminal folder, you can download it from the link below: https://disk.yandex.ru/d/DPyo0ntaevi_2A One of the best arrow indicators for Binary Options, which can also be used in the Forex market. Any time frame from M1 to MN, any currency pair, can also be used on stocks - the indicator is universal. Expiration from 1 to 5 candles. Displays traffic statistics on a graph. The indicator gives signals along th
FREE
Currency Strength Matrix (CSM) is an indicator that will show you the current strength of the major currencies in several timeframes allowing you to sort the currencies for strength and spot possible trading setups. This indicator is ideal for scalping and in all those events of sudden big moves. This DEMO only shows 4 currencies and 4 timeframes, for the full version please check https://www.mql5.com/en/market/product/24252 How does it work? The CSM compares the value of the current moving ave
FREE
Time Session OPEN-HIGH-LOW-CLOSE This Indicator Will Draw Lines Of OHLC Levels Of Time Session Defined By User. It Will Plot Floating Lines On Current Day Chart. Time Session Can Of Current Day Or Previous Day. You Can Plot Multiple Session Lines By Giving Unique ID To Each Session. It Can Even Show Historical Levels Of Time Session Selected By User On Chart To Do Backdating Test. You Can Write Text To Describe The Lines.
FREE
Safe Fund MT4
Nguyen Phuc Hung Thinh
We use Price Action and Japanese Candlesticks at important price zones and standard times to open positions and use Risk/Reward: 1/2 - 0.2%/trade. Recommended symbol:    EURUSD, GBPUSD, AUDUSD, USDCAD, USDJPY, GBPJPY, EURJPY. Contact me: Gmail: fifund.cuscare@gmail.com,   Facebook , Twitter , Instagram . Product: Metatrader4 , Metatrader5 . Broker references:  Exness ,  ICMarket ,  FBS .
FREE
Buyers of this product also purchase
Gann Made Easy
Oleg Rodin
4.83 (160)
Gann Made Easy is a professional and easy to use Forex trading system which is based on the best principles of trading using the theory of W.D. Gann. The indicator provides accurate BUY and SELL signals including Stop Loss and Take Profit levels. You can trade even on the go using PUSH notifications. PLEASE CONTACT ME AFTER PURCHASE TO GET TRADING  INSTRUCTIONS AND GREAT EXTRA INDICATORS   FOR FREE! Probably you already heard about the Gann trading methods before. Usually the Gann theory is a ve
M1 Sniper
Oleg Rodin
5 (21)
M1 SNIPER is an easy to use trading indicator system. It is an arrow indicator which is designed for M1 time frame. The indicator can be used as a standalone system for scalping on M1 time frame and it can be used as a part of your existing trading system. Though this trading system was designed specifically for trading on M1, it still can be used with other time frames too. Originally I designed this method for trading XAUUSD and BTCUSD. But I find this method helpful in trading other markets a
Scalper Inside PRO
Alexey Minkov
4.74 (69)
12% OFF EASTER SALE An exclusive indicator that utilizes an innovative algorithm to swiftly and accurately determine the market trend. The indicator automatically calculates opening, closing, and profit levels, providing detailed trading statistics. With these features, you can choose the most appropriate trading instrument for the current market conditions. Additionally, you can easily integrate your own arrow indicators into Scalper Inside Pro to quickly evaluate their statistics and profitabi
Ultimate Sniper Dashboard
Hispraise Chinedum Abraham
4.82 (22)
Currently on massive July Discount! Prices will increase in the future! Read description below! Once you purchase, send a message to my inbox for manual and starter kit. Best Entry System for Ultimate Sniper Dashboard: ULTIMATE DYNAMIC LEVELS. (Please Check my products) The Ultimate Sniper Dashboard ONLY works on live markets due to MT4 multicurrency testing limits. Introducing the Ultimate-Sniper Dashboard! Our very best which contains both HA-Sniper, MA-Sniper. and many special modes. The Ul
Market Makers
Mohamed Hassan
5 (3)
After purchase, contact me privately to receive 1 month of free testing with EA Forex Proton! This advanced MT4 trading robot automatically executes signals from any MT4 indicator, including Market Makers. The latest version also includes AI integration, allowing each trade signal to be analyzed using Artificial Intelligence. Live Signal with EA Forex Proton: Click here Market Makers is a powerful price action trading system designed to identify high-probability Buy and Sell opportunities based
Trend Screener
STE S.S.COMPANY
4.79 (95)
Trend Screener Indicator --Professional Trend Trading & Market Scanning System for MetaTrader Unlock the true power of trend trading with Trend Screener Indicator — a complete multi-currency, multi-timeframe trend analysis solution   powered by Fuzzy Logic,Trend Pulse Technology  and advanced market structure algorithms.   Trend Screener transforms your MetaTrader platform into a professional-grade Trend Analyzer and Market Scanner, helping you identify high-probability trend opportunities, ear
Atomic Analyst
Issam Kassas
5 (5)
First of all Its worth emphasizing here that this Trading Indicator is   Non-Repainting , Non Redrawing and Non Lagging Indicator   Indicator, Which makes it ideal from both manual and robot trading.  User manual: settings, inputs and strategy . The Atomic Analyst  is a PA Price Action Indicator that uses Strength and Momentum of the price to find a better edge in the market. Equipped with Advanced filters which help remove noises and false signals, and Increase Trading Potential. Using Multiple
Super Signal – Skyblade Edition Professional No-Repaint / No-Lag Trend Signal System with Exceptional Win Rate | For MT4 / MT5 It works best on lower timeframes, such as 1-minute, 5-minute, and 15-minute charts. Core Features: Super Signal – Skyblade Edition is a smart signal system designed specifically for trend trading. It applies a multi-layered confirmation mechanism to detect only strong, directional moves supported by real momentum. This system does not attempt to predict tops or bottoms
Introducing ON Trade Waves Patterns Harmonic Elliot Wolfe, an advanced indicator designed to detect various market patterns using both manual and automated methods. Here's how it works: Harmonic Patterns: This indicator can identify harmonic patterns that appear on your chart. These patterns are essential for traders practicing harmonic trading theory, as popularized by Scott Carney's book "Harmonic Trading vol 1&2." Whether you draw them manually or rely on automated detection, ON Trade Waves
The " Dynamic Scalper System " indicator is designed for the scalping method of trading within trend waves. Tested on major currency pairs and gold, compatibility with other trading instruments is possible. Provides signals for short-term opening of positions along the trend with additional price movement support. The principle of the indicator. Large arrows determine the trend direction. An algorithm for generating signals for scalping in the form of small arrows operates within trend waves.
PRO Renko System
Oleg Rodin
5 (30)
PRO Renko System is a highly accurate trading system specially designed for trading RENKO charts. The ARROWS and Trend Indicators DO NOT REPAINT! The system effectively neutralizes so called market noise giving you access to accurate reversal signals. The indicator is very easy to use and has only one parameter responsible for signal generation. You can easily adapt the tool to any trading instrument of your choice and the size of the renko bar. I am always ready to provide extra support to help
TPSpro RFI Levels
Roman Podpora
4.86 (28)
INSTRUCTIONS RUS   /   INSTRUCTIONS   ENG   -   VERSION  MT5 Main functions: Displays active zones of sellers and buyers! The indicator displays all the correct first impulse levels/zones for purchases and sales. When these levels/zones are activated, where the search for entry points begins, the levels change color and are filled with certain colors. Arrows also appear for a more intuitive perception of the situation. LOGIC AI - Display of zones (circles) for searching entry points when activa
BTMM State Engine Pro is a MetaTrader 4 indicator for traders who use the Beat The Market Maker approach: Asian session context, kill zone timing, level progression, peak formation detection, and a multi-pair scanner from a single chart. It combines cycle state logic with a built-in scanner dashboard so you do not need the same tool on many charts at once. What it does Draws the Asian session range; session times can follow broker server offset or be set in inputs. Tracks level progression (L
Linear Trend Predictor - A trend indicator that combines entry points and direction support lines. It works on the principle of breaking through the High/Low price channel. The indicator algorithm filters market noise, takes into account volatility and market dynamics. Indicator capabilities Using smoothing methods, it shows the market trend and entry points for opening BUY or SELL orders. Suitable for determining short-term and long-term market movements by analyzing charts on any timeframes.
Trading Special –40% OFF Best Solution for any Newbie or Expert Trader! This Indicator is a unique, high quality and affordable trading tool because we have incorporated a number of proprietary features and a new formula. With only ONE chart you can read Currency Strength for 28 Forex pairs! Imagine how your trading will improve because you are able to pinpoint the exact trigger point of a new trend or scalping opportunity? User manual: click here That's the first one, the original! Don't buy a
Easy Breakout
Mohamed Hassan
4.71 (14)
After your purchase, feel free to contact me for more details on how to receive a bonus indicator called VFI, which pairs perfectly with Easy Breakout for enhanced confluence!    Easy Breakout is a powerful price action trading system built on one of the most popular and widely trusted strategies among traders: the Breakout strategy ! This indicator delivers crystal-clear Buy and Sell signals based on breakouts from key support and resistance zones. Unlike typical breakout indicators, it levera
Volatility Trend System - a trading system that gives signals for entries. The volatility system gives linear and point signals in the direction of the trend, as well as signals to exit it, without redrawing and delays. The trend indicator monitors the direction of the medium-term trend, shows the direction and its change. The signal indicator is based on changes in volatility and shows market entries. The indicator is equipped with several types of alerts. Can be applied to various trading ins
Trend Lines PRO
Roman Podpora
5 (1)
TREND LINES PRO    helps understand where the market is truly changing direction. The indicator shows real trend reversals and points where major players re-enter. You see   BOS lines   Trend changes and key levels on higher timeframes — without complex settings or unnecessary noise. Signals don't repaint and remain on the chart after the bar closes. VERSION MT 5     -     Reveals its maximum potential when paired with the   RFI LEVELS PRO  indicator What the indicator shows: Real shifts   tren
GOLD Impulse with Alert
Bernhard Schweigert
4.67 (12)
This indicator is a super combination of our 2 products  Advanced Currency IMPULSE with ALERT  and  Currency Strength Exotics . It works for all time frames and shows graphically impulse of strength or weakness for the 8 main currencies plus one Symbol! This Indicator is specialized to show currency strength acceleration for any symbols like Gold, Exotic Pairs, Commodities, Indexes or Futures. Is first of its kind, any symbol can be added to the 9th line to show  true currency strength accelerat
Order Block Hunter
Noha Mohamed Fathy Younes Badr
5 (10)
Order block hunter indicator is the best indicator for  hunt the order blocks that area where there has been a large concentration of limit orders waiting to be executed Order blocks are identified on a chart by observing previous price action and looking for areas where the price experienced significant movement or sudden changes in direction .This indicator does that for you by using very complicated codes and helps you to take the best areas To buy and sell because it make marks at the best a
- Real price is 80$ - 40% Discount (It is 49$ now) Contact me for instruction, add group and any questions! - Non-repaint - I just sell my products in Elif Kaya profile, any other websites are stolen old versions, So no any new updates or support. - Lifetime update free Related product:   Bitcoin Expert Introduction The breakout and retest strategy is traded support and resistance levels. it involves price breaking through a previous level.  The break and retest strategy is designed to help tr
KT Gaussian Trend Filter MT4
KEENBASE SOFTWARE SOLUTIONS
The KT Gaussian Trend Filter combines Gaussian filtering with linear regression smoothing to deliver clear and accurate trend analysis. It generates easy-to-follow buy and sell signals while effectively highlighting the market's long-term direction. Features Fully Customizable Gaussian Filter: Adjust length and pole settings to fine-tune smoothing precision and enhance trend clarity. Linear Regression Enhancement: Further refines the Gaussian smoothing, minimizing false signals caused by market
Special offer : ALL TOOLS , just $35 each! New tools   will be   $30   for the   first week   or the   first 3 purchases !  Trading Tools Channel on MQL5 : Join my MQL5 channel to update the latest news from me The Volumetric Order Blocks Multi Timeframe indicator is a powerful tool designed for traders who seek deeper insights into market behavior by identifying key price areas where significant market participants accumulate orders. These areas, known as Volumetric Order Blocks, can serve as
Advanced Supply Demand
Bernhard Schweigert
4.91 (299)
Trading Special – 40% OFF Best Solution for any Newbie or Expert Trader! This indicator is a unique, high quality and affordable trading tool because we have incorporated a number of proprietary features and a new formula. With this update, you will be able to show double timeframe zones. You will not only be able to show a higher TF but to show both, the chart TF, PLUS the higher TF: SHOWING NESTED ZONES. All Supply Demand traders will love it. :) Important Information Revealed Maximize the pot
Route Lines Prices is an indicator designed for finding price directions. Its simple interface contains multiple algorithms for price behavior and future direction calculations. These algorithms include volatility calculations and price smoothing based on the timeframes used. The indicator has a single parameter for changing the " Calculating Price Values " value. The default value of 1 provides a balanced automatic calculation, which can be used without manually configuring the indicator. By m
Stratos Pali
Michela Russo
4.43 (7)
Stratos Pali Indicator   is a revolutionary tool designed to enhance your trading strategy by accurately identifying market trends. This sophisticated indicator uses a unique algorithm to generate a complete histogram, which records when the trend is Long or Short. When a trend reversal occurs, an arrow appears, indicating the new direction of the trend. Important Information Revealed Leave a review and contact me via mql5 message to receive My Top 5 set files for Stratos Pali at no cost! Dow
Trading Special – 40% OFF Best Solution for any Newbie or Expert Trader! This dashboard software is working on 28 currency pairs plus one. It is based on 2 of our main indicators (Advanced Currency Strength 28 and Advanced Currency Impulse). It gives a great overview of the entire Forex market plus Gold or 1 indices. It shows Advanced Currency Strength values, currency speed of movement and signals for 28 Forex pairs in all (9) timeframes. Imagine how your trading will improve when you can watch
Daily Candle Predictor is an indicator that predicts the closing price of a candle. The indicator is primarily intended for use on D1 charts. This indicator is suitable for both traditional forex trading and binary options trading. The indicator can be used as a standalone trading system, or it can act as an addition to your existing trading system. This indicator analyzes the current candle, calculating certain strength factors inside the body of the candle itself, as well as the parameters of
Scalper Vault
Oleg Rodin
5 (36)
Scalper Vault is a professional scalping system which provides you with everything you need for successful scalping. This indicator is a complete trading system which can be used by forex and binary options traders. The recommended time frame is M5. The system provides you with accurate arrow signals in the direction of the trend. It also provides you with top and bottom signals and Gann market levels. The indicator provides all types of alerts including PUSH notifications. PLEASE CONTACT ME AFT
Miraculous Indicator – 100% Non-Repaint Forex and Binary Tool Based on Gann Square of Nine This video introduces the Miraculous Indicator , a highly accurate and powerful trading tool specifically developed for Forex and Binary Options traders. What makes this indicator unique is its foundation on the legendary Gann Square of Nine and Gann's Law of Vibration , making it one of the most precise forecasting tools available in modern trading. The Miraculous Indicator is fully non-repaint, meaning t
More from author
Extreme TMA System with Arrows Indicator And Buy/Sell Boxes with Take Profit & Stop Loss This is a Non-Repainting Arrows Indicator based on the Extreme TMA System. It shows TMA cross signals and the best BUY/SELL signals. Along with the most predicted TakeProfit. And StopLoss based on TakeProfit ratio. Please note: This is an Arrows only Indicator. Dashboard is sold separately here: https://www.mql5.com/en/market/product/44825 About Indicator: This indicator shows BUY/SELL Signal Arrows and
About: The Nadaraya-Watson Envelope is a sophisticated yet practical technical indicator that helps traders identify overbought and oversold conditions using advanced kernel regression methods. This is the MT5 only Version. For MT4 Version go here: https://www.mql5.com/en/market/product/158640/ Key Features ATR-Based Bands: Three upper and three lower bands provide graduated overbought/oversold zones Logarithmic Scale Calculation Center Line - bullish (teal) or bearish (red) What is the Nad
FREE
A Fibonacci indicator is best used with other indicators like Pivots, Support/Resistance etc. Price tends to use Fibo levels as Support or Resistance lines. So, this indicator is very useful to know when price might reverse or if a level is crossed, price might continue the trend. Also, to find the best Take Profit and StopLoss lines. Don't use Fibo Indicator alone for trading as it might not always be accurate. Use it to make your strategies better as a supporting indicator. Settings: Auto Fib
FREE
This is a Sharkfin Arrows Indicator. Detailed explanation and TDI extras: https://www.mql5.com/en/blogs/post/759138 This indicator will show only Arrows. It does not have TDI symbols on chart. Please get the extras from links above for TDI indicators. Sharkfin Scanner (paid): https://www.mql5.com/en/market/product/123566 TDI Scanner Dash (paid): https://www.mql5.com/en/market/product/41826 About: This Indicator finds the Shark Fin Pattern. It will show an arrow in the current bar if RSI sha
FREE
How To Use Check out this post for detailed description on  All Indicator extras and template: https://www.mql5.com/en/blogs/post/758259 The Best Heiken Ashi System is a simple trading system for trading based only two indicators for generate signals: Heiken ashi smoothed and Vqzz indicator multi-timeframe. The system was created for scalping and day trading but can also be configured for higher time frames. As mentioned, the trading system is simple, you get into position when the two indica
FREE
3 Level ZZ Semafor Scanner: This is a Dashboard indicator which uses 3LZZ Indicator in the background to find semafors. It will give priority to the semafors3 because they specify a strong signal. So, even if there is a sem1 or 2 on current bar, and if Sem3 was within "Check Previous Bars for Sem 3". Then it will show Sem3 instead. Read about this in detailed post: https://www.mql5.com/en/blogs/post/758250 And get all extra Indicators/Template from above link. Please note: Number of settings
This indicator is based on Guppy's GMMA Strategy. And shows arrows when GMMA lines cross up or down. To have this indicator and get alerts for Multiple Timeframes and multiple Pairs you can check out the demo of this GMMA Trend Scanner indicator: https://www.mql5.com/en/market/product/38747 About GMMA In Brief: GMMA attempts to identify trends by combining two groups of moving averages with differing time periods: The long-term EMAs (30, 35, 40, 45, 50, and 60) the behaviors of investors that h
FREE
This is an MT5 only version. For MT4: https://www.mql5.com/en/market/product/162600/ Read detailed blogpost here with screenshots and best settings: https://www.mql5.com/en/blogs/post/766909 Introduction This tool takes raw, noisy price data and transforms it into smooth, easy-to-read trend lines that make market direction much clearer. Whether you’re a day trader, swing trader, or long-term position trader, this indicator can adapt to your style thanks to flexible kernel selection, adjustab
Detailed blogpost: https://www.mql5.com/en/blogs/post/766378 Key Features Adaptive Upper/Lower bands Smooth Center Line Customizable Length (sensitivity) Non-Repainting (only current ongoing bar is updated every "Refresh After Ticks" number of ticks) Multiple Price Sources - Choose from close, open, high, low, median, typical, or weighted close Components: The Basis Line The smooth center line represents the weighted average of price. Think of this as the "true" price level when all the noise
FREE
Abiroid Slope MA
Abir Pathak
4.67 (3)
Features: - Moving Average Slope for Max Past Bars - Slope Period - Slope Thresholds - Multiple Slope Type options - See slope visually as a histogram - Info Panel Show/Hide Slope Calculations and Types: The slope value is calculated using the Slope Period. Suppose Period is 5, it will check the MA value for bar (x) and bar (x+5). And find the slope angle between them. Read detailed description about Slope Types and Settings here: https://www.mql5.com/en/blogs/post/747651
FREE
Features: 1- Get OB/OS Levels from Golden MA Levels 2- Wait for Buy/Sell Start Level Cross 3- Optional: Should price cross Mid Level in earlier bars 4- Optional: Crossing bar High/Medium Volume 5- Optional: MA Stacked to check up/down trend for current TF 6- Optional: NRTR higher timeframes aligned Check Detailed blog post explained: https://www.mql5.com/en/blogs/post/758457 Levels with Buffers available here: Golden MA Levels Indicator: https://www.mql5.com/en/market/product/119515 Note: Arr
FREE
Abiroid MA Stack
Abir Pathak
4.5 (4)
Moving Average Rainbow Stack: Free: Single Currency & Single Timeframe MA Stack Very useful for finding current and higher timeframe trends. Best suited for long term trend based trading. Use fewer MAs for quick scalping. And not suitable during low volatility. Only use during high volatility and steady trending markets. Use this to enhance your existing Trend based strategies to find best trends. Read detailed description https://abiroid.com/product/abiroid-ma-stack Available MTF and Scanner v
FREE
Description This scanner uses 3LZZ TRO ex4 and scans for Semafors at given “Shift” bar. Scanner Detailed Settings: https://www.mql5.com/en/blogs/post/747456 Other Settings: Set Periods for Semafor 1,2,3 Set alerts on/off for Semafor 1,2,3 Shift bar (Bar on which semafor is scanned) Refresh After Ticks (Number of ticks when dash is refreshed) This scanner is pretty simplistic version. And a more detailed version with a different strategy is available here: https://www.mql5.com/en/market/product
FREE
EMA Multi meter
Abir Pathak
4.92 (13)
How the Indicator Works: This is a Multi-timeframe MA multimeter indicator which studies if price is above or below a particular EMA range and shows Red/Green/Yellow signals. Red: Price Below EMA range Green: Price above range Yellow: Price within range Indicator Properties: EMA Settings: - Default Period is 200. You can change all MA Settings like Period, MA Method (SMA, EMA, etc) or MA Applied Price (Close, Open, etc). - EMA Range list is a comma separated value list for different timeframes
FREE
Abiroid Multi Slope indicator allows you to calculate a Slope Histogram for any line of any indicator . Histogram is for 1 slope line only, but slope values can be calculated for 3 lines total. To have multiple histograms, add as many Slope indicators for custom indicators as you like on chart. You just need to provide the Indicator name, buffer value, slope's period and max number of bars back. By default it has slope calculation for TDI_v4.ex4 indicator. There is no way to specify parameters f
FREE
Features: - Current TF GMMA Cross and Trend (Mandatory Check.. G-Up/G-Down) - HTF GMMA Trend Check (Optional.. slanting arrow) - TDI or NRTR Trend Check (Optional.. diamond) Read post for detailed description and downloading extra indicators: https://www.mql5.com/en/blogs/post/758264 Scanner: This is a Dashboard Scanner for finding good trades using the GMMA method as base and TDI method for trend verification. All buttons for all Pairs and Timeframes are clickable and will change the chart f
Dashboard uses Ichimoku Strategy to find best trades. Get extra Indicators/Template: And read more about detailed Product Description and usage here: https://www.mql5.com/en/blogs/post/747457 Read more about Scanner Common features in detail here: https://www.mql5.com/en/blogs/post/747456 Features: Price Kumo Breakout Tenkan-Kijun Cross Chikou/CLoud and Chikou/Price Support/Resistance (SR-SS or SR-NRTR) Stochastic OB/OS and back Awesome Oscillator Higher Timeframe Ichimoku Trend Align
TDI Multi Timeframe Scanner: This Dashboard indicator uses the TDI (Trader's Dynamic Index) Indicator to find best trades. Read detailed How to Use Guide: https://www.mql5.com/en/blogs/post/758252 Extra indicators also available in above post. Checks for: - SharkFin Pattern Free indicator for SharkFin: https://www.mql5.com/en/market/product/42405/ - TDI Trend: Strong/Weak Trend Up/Down - TDI Signal: Strong/Medium/Weak Signal for Buy/Sell - Consolidation - Overbought/Oversold - Volatility Ban
Scanner Dashboard for Best Heiken Ashi VQZZ Arrows Indicator here: https://www.mql5.com/en/market/product/45900 Check out this post for detailed description on How To Use All Indicator extras and template: https://www.mql5.com/en/blogs/post/758259 Please note that if you are using too many pairs/timeframes, then VQZZ calculations might slow down the dashboard. So be careful not to use too many VQZZ Higher timeframes if you are using too many pairs. Also, VQZZ is based on higher timeframes. e.g
Abiroid Profit Percent Series 1: Arrows Indicator Stochastic Ichimoku with ATR Get the Scanner for free. For getting Profit Percentages for Multiple Timeframes and Multiple Pairs. And read detailed description about this indicator and all the settings here. And get extra Indicators, Templates and settings for download: https://abiroid.com/product/profit-percent-stoch-ichimoku-with-atr Watch the tutorial video here: https://youtu.be/C45-9kWPE2Q About The Strategy: This strategy has 3 main par
Profit Percent Series 2 The scanner dashboard available here (for  Free) : And read detailed information about MA Confluence here: https://www.mql5.com/en/blogs/post/747474 Here's a post about Common Settings for all Profit Percent Series Indicators: https://www.mql5.com/en/blogs/post/747456 Strategy: Main Signal Indicators (Any One): MA Cross (In-built) or Hull, OBV Cross, Heiken Ashi Cross Validation Indicators (Preferably less than 3): OBV (with Min Distance), Heiken Ashi, ADX, SuperTren
This is a slope indicator for COG (Center of Gravity) indicator.   Download extra COG Indicators and read detailed description and strategy here: https://www.mql5.com/en/blogs/post/759120 Description: You can set the Slope Threshold for indicating Buy/Sell heightened levels. In the above Image the Threshold is set to 0, because of that all Bullish slope is Green and Bearish is Red. Suppose we set Threshold to -10 and 10, then this is what we get: And also set Slope Period. Default is 5, which
This Indicator uses Center of Gravity (COG) Indicator to find you the best trades. It is a reversal based Swing Indicator which contains an  Arrows Indicator. That you can buy here from Metatrader Market. Check out this blog post for detailed How to Use Guide and links to free scanner: https://www.mql5.com/en/blogs/post/758262 Scanner needs this arrows indicator in same directory to run Copy scanner ex4 in same folder as your Arrows Indicator: MQL4/Indicators/Market/ All extra indicators and
This strategy is best used for Trend based trading. While market is trending, price still makes smaller ranges. Darvas boxes show breakouts from these small ranges, while still following the original market trend. Detailed Description: https://www.mql5.com/en/blogs/post/747919 Features: Darvas - Check Darvas Box Breakout -   Check Price Above/Below MA or Darvas Box has crossed MA -   Min, Max Box Height -   Max Distance Between Entry Price and Darvas Box Other Indicators: - NRTR Trend Check
Free scanner available here: https://abiroid.com/product/abiroid-ema-scalper Basic Strategy: 1: MA Crossover Up/Down Arrow (Mandatory Check) Optional Checks: 2: If NRTR Check On (Optional): For BUY: Check if NRTR blue and For SELL: NRTR Red If NRTR Shadow Distance On (Optional): Check price for 'x' bars back: at Shadow distance (ATR Multiplier distance) from NRTR line. 3: If High Volume bar On: Check if High Volume or if Medium (if on) Volume bar 'x' bars back 4: If HTF Trend Align On (Optiona
This is a Multi-currency multi-timeframe Support/Resistance Scanner Dashboard for Metatrader 4 (MT4) platform. Get all extras and download free demo here: https://www.mql5.com/en/blogs/post/760210 Read detailed description in post above. And get the SR Indicator for individual charts. Features: Scan Support/Resistance zones (also called Supply/Demand zones) Show alert when price is inside these zones and highlights the pair/timeframe Show or hide SR zones price nearest to current price (Price
This strategy is useful for small timeframe scalping and binary options. Best timeframes: M5,M15,M30 M1 timeframe is too unpredictable. So be careful with that. Read Detailed Description and Get All: - Free Demo - Free Scanner - Extra Indicators ex4 files from https://abiroid.com/product/abiroid-donchian-scanner-and-arrows Arrows Demo only works in strategy tester. So, Arrows Demo won't work with the free scanner. Scanner needs "Abiroid Donchian Arrow.ex4" to work. So make sure both arrows and
Read detailed description and Get Free Demo and extra indicators: https://www.mql5.com/en/blogs/post/758610 Features: Halftrend Arrow Scan: Scan Max Past Bars for Halftrend arrows. Show how many bars back the arrow occurred in a bracket Past Bars Back Alerts: Num of bars back for which scanner will send alerts Halftrend HTF Align: Scan Higher timeframes for Trend Direction of Halftrend Indicator and if trends align show a slanting Green/Red Arrow for Up/Down trend Semafor 3 Check: Few bars bef
Read detailed description and extra indicators: https://www.mql5.com/en/blogs/post/758622 This Supertrend dashboard is a multi-currency and multi-timeframe dash which gives signals whenever supertrend changes it's trend direction. Please note, that this is not a full trading system. It will help you get initial Supertrend signals and higher timeframe trend alignments. And it’s to be used with your own Supertrend Strategies. Features: 1- Select one of In-Built Supertrend Indicators: xSupertren
About: Get Free Scanner and example Strategies And understand detailed description here: https://www.mql5.com/en/blogs/post/759237 And also get example wrappers from above post. You can make your own wrappers if your indicators have complex conditions or for In-Built MT4 indicators. Features: - Specify your own Custom Indicator - Specify Buffer values and create Variables - Use those Variables to create your own Buy/Sell Conditions - Get Arrows Up/Down Signals - See Arrows Signals in Scanners
Filter:
Andreas Door
76
Andreas Door 2023.04.17 20:52 
 

Very good dashboard. Individually adaptable to your own special needs. These trading signals to the mobile phone save countless hours in front of the computer. Very good product! Very good price.

Abir Pathak
52790
Reply from developer Abir Pathak 2023.04.17 23:08
Thank you :)
Giuseppe Del
33
Giuseppe Del 2022.08.10 21:00 
 

it is PERFECT!!!

Abir Pathak
52790
Reply from developer Abir Pathak 2022.08.10 21:11
Hi, You can add any pairs you like using Own Pair List from drop down. And add any symbols your broker supports, in the comma separated list. Take a look at this for settings : https://abiroid.com/indicators/abiroid-scanner-dashboard-common-settings
Hope this helps :)
Paulina Andrea Madariaga Figueroa
4202
Paulina Andrea Madariaga Figueroa 2021.02.26 15:01 
 

I don't understand how this indicator is not so popular. All of this author's products are fantastic.

Abir Pathak
52790
Reply from developer Abir Pathak 2023.04.17 23:08
Thank you :)
vhlemee
62
vhlemee 2020.06.24 15:18 
 

Extreme TMA is great! Really useful for Trend Estimation and the Support is Great!

Abir Pathak
52790
Reply from developer Abir Pathak 2023.04.17 23:09
Thank you :)
meta123physics
34
meta123physics 2020.06.22 16:02 
 

This programmer is one of the best in the business. I've always been a fan of TMA channels ever since it was made infamous by Alorente (https://www.forexfactory.com/showthread.php?t=343533). I don't trade without TMA channels, as it reflects the natural dynamic of prices to gravitate to a mean between two extremes. The dashboard is incredible and has made my life so much easier, as it provides flexibility in types of TMA channels and the the ability to manipulate it per your trading style. This programmer is willing to work with you, and approaches her work as an art form seeking perfection. Kudos to this programmer for creating the current king/queen of TMA dashboards.

Abir Pathak
52790
Reply from developer Abir Pathak 2023.04.17 23:09
Thank you :)
cam028
6487
cam028 2020.06.22 04:12 
 

im loving this product one of the best its helped my trading a lot cant wait to try the others

Abir Pathak
52790
Reply from developer Abir Pathak 2023.04.17 23:09
Thank you :)
Reply to review