Super Channel Pro Pluss
- Indicadores
- Versión: 1.0
- Activaciones: 5

Este indicador Super Channel Pro Pluss indicator.Indicator muestra la tendencia movement.Indicator calcula automáticamente line.
Características
- FiltPer - muestra el período de canal indicador.
- desviación - muestra la desviación del canal indicador.
- desviación2 - muestra la desviación del canal indicador.
- desviación3 - muestra la desviación del canal indicador.
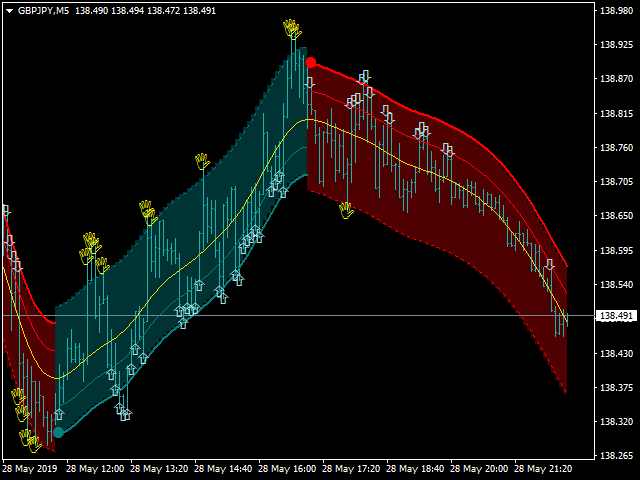
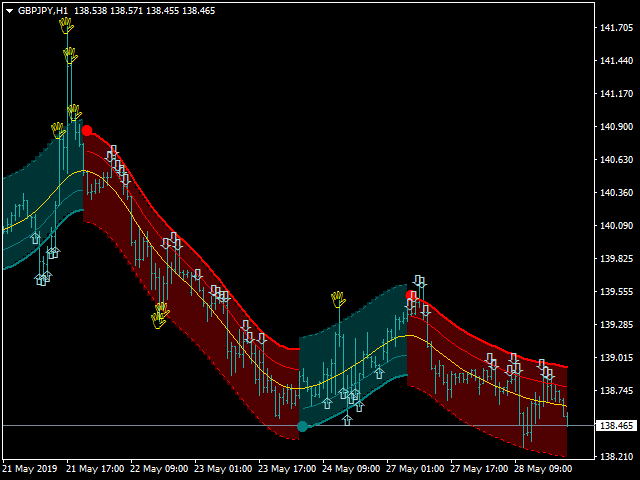
Como entender el estado:
- Si la flecha está hacia arriba y el color de la línea es verde azulado, la tendencia es alcista.
- Si la flecha es descendente y el color de la línea Rojo; la tendencia es descendente.
- Si la flecha es Amarilla cierre ; (compra,venta)
Indicador ; barras atrás = WindowFirstVisibleBar()
//////////////////////////////////////////////////////////////////////////////////////////////////////////////////////////////////////////////////////
//////////////////////////////////////////////////////////////////////////////////////////////////////////////////////////////////////////////////////
//////////////////////////////////////////////////////////////////////////////////////////////////////////////////////////////////////////////////////
/////////////////////////////////////////////////////////////////////////////////////////////////////////////////////////////////////////////////////
/////////////////////////////////////////////////////////////////////////////////////////////////////////////////////////////////////////////////////
/////////////////////////////////////////////////////////////////////////////////////////////////////////////////////////////////////////////////////
/////////////////////////////////////////////////////////////////////////////////////////////////////////////////////////////////////////////////////
/////////////////////////////////////////////////////////////////////////////////////////////////////////////////////////////////////////////////////
/////////////////////////////////////////////////////////////////////////////////////////////////////////////////////////////////////////////////////
/////////////////////////////////////////////////////////////////////////////////////////////////////////////////////////////////////////////////////
/////////////////////////////////////////////////////////////////////////////////////////////////////////////////////////////////////////////////////
/////////////////////////////////////////////////////////////////////////////////////////////////////////////////////////////////////////////////////
/////////////////////////////////////////////////////////////////////////////////////////////////////////////////////////////////////////////////////
/////////////////////////////////////////////////////////////////////////////////////////////////////////////////////////////////////////////////////
/////////////////////////////////////////////////////////////////////////////////////////////////////////////////////////////////////////////////////
/////////////////////////////////////////////////////////////////////////////////////////////////////////////////////////////////////////////////////
/////////////////////////////////////////////////////////////////////////////////////////////////////////////////////////////////////////////////////
/////////////////////////////////////////////////////////////////////////////////////////////////////////////////////////////////////////////////////