• Genel bakış
  • İncelemeler (1)
  • Yorumlar
  • Yenilikler

StatChannel

5

The principle of the indicator.

              The StatChannel ( SC) indicator is a development of the Bollinger Bands indicator ( ВВ).  BB is a moving average, on both sides of which two lines are drawn, separated from it by standard deviations std multiplied by the corresponding coefficient. At the same time, a moving average with an averaging period (2n + 1) bars is always obtained lagging behind n bars.  Sliding std is also lagging behind on n bars, also calculated by (2n + 1) points. Such a strong delay reduces the efficiency of using BB.

              The SC indicator is constructed in the same way as a classic BB, but only on the basis of the non-lagging moving average. Such a curve is calculated at points (Inf, n + 1], as a moving average at the segment (Inf, 0], where 0 is the number of the last bar, shifted back by n bars, and at the points of the segment [n, 0] it is estimated. The estimate is a curvilinear sector (sweeping confidence interval) in which the line of the non-lagging moving average is laid with a given confidence level. The non-lagging  average is also surrounded by non-lagging  std, which is determined at points at points (Inf, n + 1) in the same way as the non-lagging  moving average, and at points of the segment [n, 0] - by a special algorithm that calculates the set of values std, that will be within the specified value of the confidence interval. 


Trade using the SC indicator.

              The SC indicator builds the distribution patterns of the current channels, into which all price fluctuations fit in heap and evenly. The figure of the middle line gives directly those values ​​for the current price that fit into the given (in the settings) confidence level. The figures of the upper and lower lines describe the allowable variations in price fluctuations at the top and bottom, respectively.

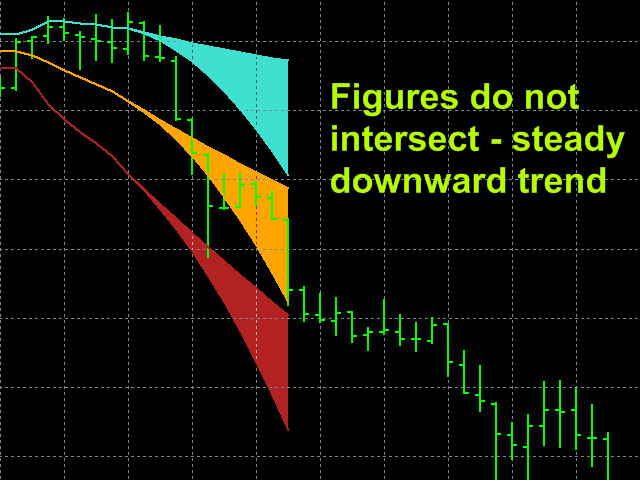
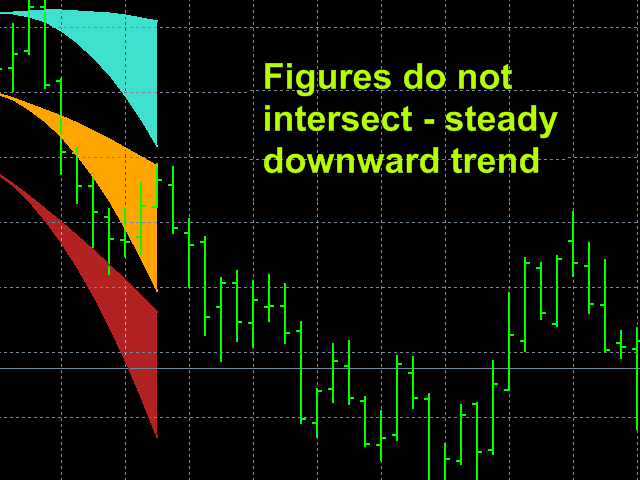
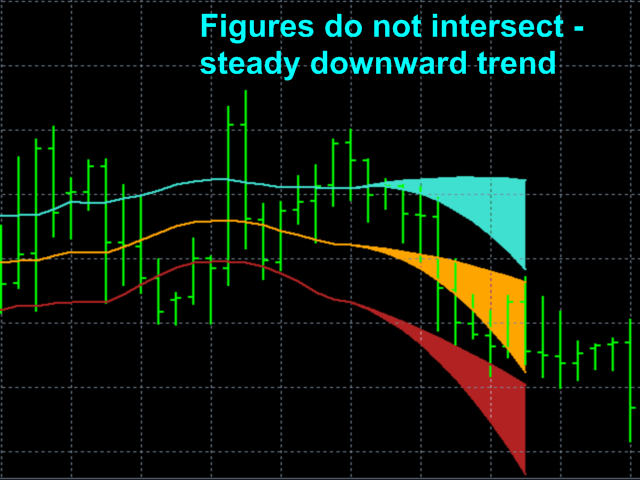
             If the lower border of the figure sector of the middle component of the SC indicator moves to the up, then there is an upward trend. If the upper boundary of the curvilinear sector of the middle component of the SC indicator is oriented downwards, then there is a downward trend. In such cases, you can be confident in the correctness of the established trend direction with a given confidence level.

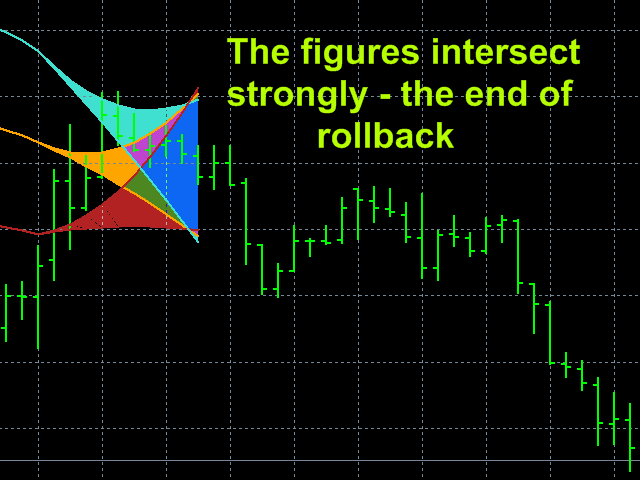
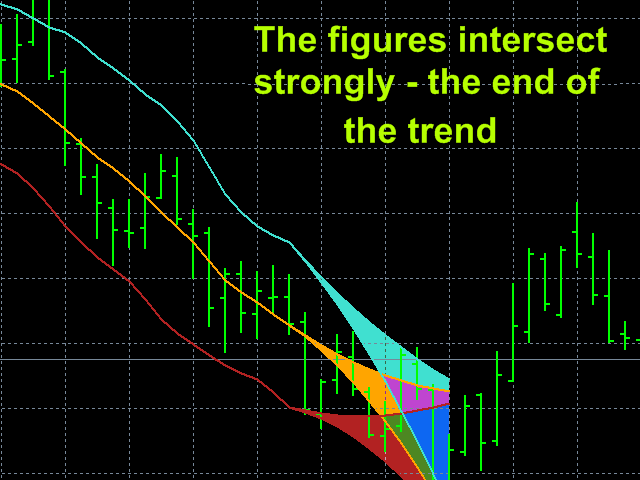
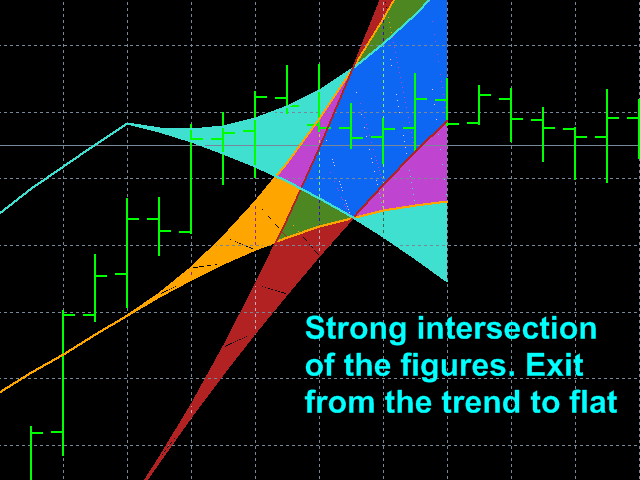
             If the upper limit of the figure sector of the middle component of the SC indicator moves to the up, and the lower limit moves down, then there is a flat, which serves as a signal for closing trend positions.

             If the colored sectors are clearly divided, then when the price approaches the upper edge of the upper line, you need to open a position on Sell, and when the price approaches the lower edge of the lower line on Buy, which, of course, needs to be done if there is a pronounced trend with regard to it directions, i.e. Do not play against this trend. Closing positions, on the contrary, Sell when the price drops to the figure sector of the lower line, and Buy when the price rises to the figure sector of the upper line.       

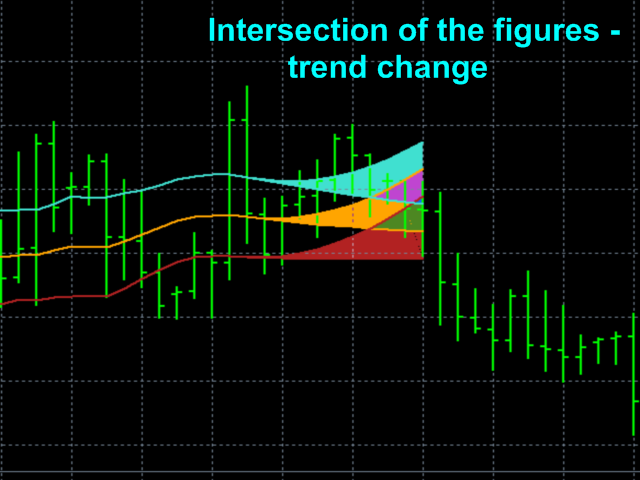
      A strong overlap of sectors indicates a high probability of a change in trend.


Indicator settings.

  • Price type  - applied price. Values: Close price, Open price, High price, Low price, Median price  ((high + low)/2 - default),  Typical price ((high + low + close)/3),    Weighted  price  ((high + low + 2*close)/4). 
  • The averaging method   - averaging method. Values:  Simple (default), Exponential, Smoothed,  Linear  weighted.
  • The averaging period    -  averaging period. Values:  any integer  (21 default).
  • Confidence probability Values:   any real number  from  0  to  0.999 (0.67 default).    
  • Channel width factor in STD  - channel width factor in standard deviations.  Values:   any real number  (1.0  default).
  • Global shift - Global shift of the beginning of the indicator readings in bars. Values: any positive integer  (0 default).
  • Top line color – Color of the top line and figure sector. Default Turquoise.
  • Midline color -  Color of the midline and figure sector.  Default Orange.
  • Bottom line color - Color of the bottom line and figure sector. Default FireBrick.
  • Paint over the confidence interval? - To color the figure sector of the confidence interval?  Values:   true (default),  false.
İncelemeler 1
Aravind Kolanupaka
8820
Aravind Kolanupaka 2019.06.09 02:03 
 

Good indicator.

Önerilen ürünler
VR Cub
Vladimir Pastushak
VR Cub , yüksek kaliteli giriş noktaları elde etmenin bir göstergesidir. Gösterge, matematiksel hesaplamaları kolaylaştırmak ve bir pozisyona giriş noktalarının aranmasını basitleştirmek için geliştirildi. Göstergenin yazıldığı ticaret stratejisi uzun yıllardan beri etkinliğini kanıtlamaktadır. Ticaret stratejisinin basitliği, acemi yatırımcıların bile başarılı bir şekilde ticaret yapmasına olanak tanıyan büyük avantajıdır. VR Cub, pozisyon açılış noktalarını ve Kâr Al ve Zararı Durdur hedef sev
Infinity Trend Pro
Yaroslav Varankin
1 (1)
This is a trend indicator without redrawing Developed instead of the binary options strategy (by the color of the Martingale candlestick) Also works well in forex trading When to open trades (binary options) A signal will appear in the place with a candle signaling the current candle It is recommended to open a deal for one candle of the current timeframe M1 and M5 When a blue dot appears, open a deal up When a red dot appears, open a trade down. How to open trades on Forex. When a signal is rec
The indicator detects and displays Shark harmonic pattern (see the screenshot). The pattern is plotted by the extreme values of the ZigZag indicator (included in the resources, no need to install). After detecting the pattern, the indicator notifies of that by a pop-up window, a mobile notification and an email. The indicator highlights the process of the pattern formation and not just the complete pattern. In the former case, it is displayed in the contour triangles. After the pattern is comple
The indicator detects and displays 3 Drives harmonic pattern (see the screenshot). The pattern is plotted by the extreme values of the ZigZag indicator (included in the resources, no need to install). After detecting the pattern, the indicator notifies of that by a pop-up window, a mobile notification and an email. The indicator highlights the process of the pattern formation and not just the complete pattern. In the former case, it is displayed in the contour triangles. After the pattern is com
Infinity'nin para birimlerinin gücünü ölçen bu yenilikçi gösterge, scalper'lar ve uzun vadeli ticaret yapan tüccarlar için vazgeçilmez bir yardımcıdır. Para birimlerinin Güç / zayıflık analiz sistemi uzun zamandır bilinmektedir ve dünyanın önde gelen tüccarları tarafından piyasada kullanılmaktadır. Herhangi bir arbitraj ticareti bu analiz olmadan tamamlanamaz. Göstergemiz, temel para birimlerinin birbirine göre gücünü kolayca belirler. Tüm para birimlerinde veya mevcut para birimlerinde çizgi g
Owl smart levels
Sergey Ermolov
4.63 (54)
MT5 versiyonu  |  FAQ Owl Smart Levels Indicator ,   Bill Williams'ın gelişmiş fraktalları , piyasanın doğru dalga yapısını oluşturan Valable ZigZag ve kesin giriş seviyelerini gösteren   Fibonacci seviyeleri   gibi popüler piyasa analiz araçlarını içeren tek gösterge içinde eksiksiz bir ticaret sistemidir. pazara ve kar elde edilecek yerlere. Stratejinin ayrıntılı açıklaması Gösterge ile çalışma talimatı Baykuş Yardımcısı ticaretinde Danışman Yardımcısı Kullanıcıların özel sohbeti -> Satın ald
This indicator is the undisputed leader among the indicators. And for this statement there is a good reason. The indicator builds a very high quality channel in which it generates signals to enter! What is the ideal strategy for the trader, since the trader always hesitates when choosing a strategy for the job. That is, this indicator will allow you to solve the dilemma of choosing a job by trend or to the channel, since it combines these two basic concepts. Working with the indicator is very
PABT Pattern Indicator - it's classical system one of the signal patterns. Indicator logic - the Hi & Lo of the bar is fully within the range of the preceding bar, look to trade them as pullback in trend. In the way if indicator found PABT pattern it's drawing two lines and arrow what showing trend way.  - First line - it's entry point and drawing at: 1. On the high of signal bar or on middle of the signal bar (depending from indicator mode) for buy; 2. On the low of signal bar or on middle of t
The indicator displays the data of the Stochastic oscillator from a higher timeframe on the chart. The main and signal lines are displayed in a separate window. The stepped response is not smoothed. The indicator is useful for practicing "manual" forex trading strategies, which use the data from several screens with different timeframes of a single symbol. The indicator uses the settings that are identical to the standard ones, and a drop-down list for selecting the timeframe. Indicator Parame
Based on MACD indicator waves with standard parameters Applies Fibonacci levels to the last two MACD waves, positive and negative respectively, if at the moment the MACD indicator runs out of negative Wave - the color is green, if at the moment the MACD indicator runs out of positive Wave - the color is red. The Wave termination criterion is two ticks with a different MACD sign. Applies trend lines on the last four MACD Waves. Works well with the expert Figures MACD   https://www.mql5.com/ru/mar
This is a combination of multiple oscillators into a single divergence system that creates the impression of a more reliable divergence indicator. It is multi-currency based and works best on 15 minutes timeframe and above. Every time a signal is generated, it shows an alert to the user. It is more ideal if combined with other price action indicators or trading systems.
Super Gator
Agustinus Biotamalo Lumbantoruan
This indi shows the following 1. Supertrend 2. Alligator (Not a regular alligator) 3. ZigZag 4. Moving Average 5. Trend Continuation/Mini correction Signal (plotted in X) (See screenshots in green background color 6. Early Signal Detection (See screenshots in green background color) You may treat Alligator as the lagging indicator The leading indicator is the supertrend. The zig zag is based on the leading indicator where it gets plotted when the leading indicator got broken to the opposite.
RSX Signal 2 AM
Andriy Matviyevs'kyy
The indicator displays the signals of the RSX oscillator on the price chart. (To display these signals in a separate window, along with the oscillator, another indicator is used -  RSX Osc 4 AM ). It is optimal to use the indicator signals as signals to open a trade when the price overcomes the maximum or minimum of the bar at which the signal was given. An opposite signal cancels the previous signal. Settings: Data period for indicator calculation - data period for indicator calculation; Data
FREE
ZhiBiCCI MT4
Qiuyang Zheng
5 (1)
[ZhiBiCCI] indicators are suitable for all cycle use, and are also suitable for all market varieties. [ZhiBiCCI] Green solid line is a reversal of bullish divergence. The green dotted line is a classic bullish divergence. [ZhiBiCCI] The solid line to the red is a reverse bearish divergence. The red dotted line is a classical bearish divergence. [ZhiBiCCI] can be set in the parameters (Alert, Send mail, Send notification), set to (true) to send instant signals to the alarm window, email, in
The LineMagnit Indicator for MT4 is a highly precise tool that builds support and resistance levels which magnetically attract prices. This feature allows traders to easily determine the most probable entry and exit points in the market, as well as identify the market's directional forces, as levels are based on capital inflows into the instrument. Equipped with an intuitively understandable graphical interface, the LineMagnit Indicator enables users to quickly locate and analyze support and res
Trend Ray
Andriy Sydoruk
The indicator shows the potential trend direction by cyclical-wave dependence. Thus, all the rays of the intersection will be optimal rays, in the direction of which the price is expected to move, taking into account the indicator period. Rays can be used as a direction for potential market movement. But we must not forget that the approach must be comprehensive, the indicator signals require additional information to enter the market.
COG LR Osc AM
Andriy Matviyevs'kyy
The presented indicator allows you to determine potential entry points into the market and set protective orders at reasonable levels. This product can be useful for both beginners and experienced traders. The indicator is based on calculation methods proven by time and practicing traders. The indicator is calculated in two stages: At the first stage, linear regression (LR) of the selected price type is determined for a given number of chart periods. At the second stage, the obtained data is p
FREE
The Th3Eng PipFinite indicator is based on a very excellent analysis of the right trend direction with perfect custom algorithms. It show the true direction and the best point to start trading. With StopLoss point and Three Take Profit points. Also it show the right pivot of the price and small points to order to replace the dynamic support and resistance channel, Which surrounds the price. And Finally it draws a very helpful Box on the left side on the chart includes (take profits and Stop loss
The CCI Divergence is a reasonably useful indicator in itself, but it is even more effective when used with divergence pattern trading. The CCI Divergence indicator signal is one of the most potent signals among the indicators that exist in the market. Here is new version for Divergence Indicator using CCI method, with more improvements. Divergences indicate a potential investment point because the directional moment does not confirm the price. A bullish divergence occurs when the underlying
Nice Trade Point
Muhammed Emin Ugur
This    Nice Trade Point     indicator is designed for signal trading. This indicator generates trend signals. It uses many algorithms and indicators to generate this signal. It tries to generate a signal from the points with the highest trend potential. This indicator is a complete trading product. This indicator does not need any additional indicators. The indicator certainly does not repaint. The point at which the signal is given does not change.     Features and Suggestions Time
"Adjustable Fractals" - is an advanced version of fractal indicator, very useful trading tool! As we know   Standard fractals mt4 indicator does not have settings at all   - this is very inconvenient for traders Adjustable Fractals has resolved that issue - it has all necessary settings: Adjustable period   of indicator (recommended values - above 7) Adjustable distance   from Highs/Lows of price Adjustable design   af fractal arrows // More great Expert Advisors and Indicators are available he
Fractal Zig Zag
Mikhail Nazarenko
5 (1)
A   professional version of the ZigZag indicator for visualizing the structure of price movements by fractals. Fractal ZigZag fixes the flaws of the standard version of the ZigZag indicator MT4. It uses Price action and a unique filtering algorithm to determine fractals. Suitable for all types of trading. Ideal for trading according to the WM pattern "Sniper" strategy !!! Features Marks the place of price reversal during the formation of a new fractal with specified parameters. Suitable for
KDJ Index 4   交易实用必备工具指标 波浪自动计算指标,通道趋势交易 完美的趋势-波浪自动计算通道计算 , MT4版本 完美的趋势-波浪自动计算通道计算 , MT5版本 本地跟单复制交易 Easy And Fast Copy , MT4版本 Easy And Fast Copy , MT5版本 本地跟单复制交易 模拟试用 Easy And Fast Copy , MT4 模拟账号运行 Easy And Fast Copy , MT5 模拟账号运行 "Cooperative QQ:556024  "  "Cooperation wechat:556024"  "Cooperative email:556024@qq.com" 强烈推荐趋势指标, 波浪的标准自动计算   和   波浪的标准自动计算MT5版本     KDJ指标又叫 随机指标 ,是一种相当新颖、实用的技术分析指标,它起先用于期货市场的分析,后被广泛用于股市的中短期趋势分析,是期货和股票市场上最常用的技术分析工具。 随机指标KDJ一般是用于股票分析的统计体系,根据统计学原理,通过一个特定的周期(常为9日、9周等
Master Scalping M1 , trendi hızlı ve doğru bir şekilde belirlemek için bir algoritma kullanan yenilikçi bir göstergedir. Gösterge, pozisyonların açılış ve kapanış zamanını hesaplar, gösterge algoritmaları, bir ticarete girmek (bir varlık satın almak veya satmak) için ideal anları bulmanızı sağlar, bu da çoğu tüccar için işlemlerin başarısını artırır. Göstergenin faydaları: Kullanımı kolaydır, çizelgeyi gereksiz bilgilerle aşırı yüklemez. Herhangi bir strateji için bir filtre olarak kullanılabili
MetaCOT 2 is a set of indicators and specialized utilities for the analysis of the U.S. Commodity Futures Trading Commission reports. Thanks to the reports issued by the Commission, it is possible to analyze the size and direction of the positions of the major market participants, which brings the long-term price prediction accuracy to a new higher-quality level, inaccessible to most traders. These indicators, related to the fundamental analysis, can also be used as an effective long-term filter
Wave Wolf MT4
Andrei Salanevich
Forex Dalga Kurt MT4 göstergesi, Wolf dalgalarını aramak ve mevcut ticaret terminali penceresinde görüntülemek için tasarlanmıştır. Ticarette Wolfe dalgalarını kullanan tüccarlar için mükemmel bir gösterge. Ticaret stratejilerinde kullanımı, verimliliğini ve karlılığını önemli ölçüde artıracaktır. GÖSTERGE BİLGİSİ Diğer Wolf dalga göstergelerinin aksine, forex Wave Wold MT4 göstergesinin etkinliğini önemli ölçüde artıran birçok özelliği vardır: Birincisi, Açık Windows 5Point (true) ayarı bi
Trend Master Chart MT4
Frederic Jacques Collomb
Trend Master Chart ihtiyacınız olan trend göstergesidir. Grafiği kaplar ve farklı pazar trendlerini/hareketlerini tanımlamak için renk kodlamasını kullanır. İki hareketli ortalamayı ve farklı osilatörleri birleştiren bir algoritma kullanır. Bu üç elementin periyotları değiştirilebilir. Herhangi bir zaman diliminde ve herhangi bir Çiftte çalışır. Bir bakışta yükseliş veya düşüş trendini ve bu trende farklı giriş noktalarını tespit edebileceksiniz. Örneğin, belirgin bir yükseliş eğilimi sırasın
FREE
Trend Monitor
Pavel Zamoshnikov
4.2 (5)
The indicator generates early signals basing on ADX reading data combined with elements of price patterns. Works on all symbols and timeframes. The indicator does not redraw its signals. You see the same things on history and in real time. For better visual perception signals are displayed as arrows (in order not to overload the chart). Features Easy to use. Filter configuration only requires selection of sensitivity in the " Sensitivity of the indicator " input. Signals can be filtered usin
Trend Scanner
Vladimir Kalendzhyan
4.38 (8)
By purchasing this indicator, you have the right to receive a free copy of one of   my other indicator's or advisor’s!  (All future updates are included. No limits) . To get it , please contact me by  mql5 message ! The Trend Scanner trend line indicator displays the trend direction and its changes. The indicator works on all currency pairs and  timeframes. The indicator simultaneously displays multiple readings on the price chart: the support and resistance lines of the currency pair, the exist
This indicator is another variant of the famous powerful indicator Fibonacci-SS https://www.mql5.com/en/market/product/10136 but has different behaviour in placing Pending Order and TP Line. Automatically places Fibonacci retracement lines from the last highest and lowest visible bars on the chart with: An auto Pending Order (Buy/Sell). Taking Profit 1, Taking Profit 2 is pivot point and Taking Profit 3 for extended reward opportunity. The best risk and reward ratio. Simple and powerful indica
Bu ürünün alıcıları ayrıca şunları da satın alıyor
Gann Made Easy
Oleg Rodin
4.96 (45)
Gann Made Easy , bay teorisini kullanarak ticaretin en iyi ilkelerine dayanan, profesyonel ve kullanımı kolay bir Forex ticaret sistemidir. WD Gann. Gösterge, Zararı Durdur ve Kâr Al Seviyeleri dahil olmak üzere doğru SATIN AL ve SAT sinyalleri sağlar. PUSH bildirimlerini kullanarak hareket halindeyken bile işlem yapabilirsiniz. Lütfen satın aldıktan sonra benimle iletişime geçin! Alım satım ipuçlarımı ve harika bonus göstergelerini ücretsiz olarak sizinle paylaşacağım! Muhtemelen Gann ticaret y
Atomic Analyst
Issam Kassas
5 (1)
Öncelikle belirtmek gerekir ki bu Ticaret Göstergesi Yeniden Çizim Yapmaz, Gecikmez ve Gecikme Göstermez, bu da hem manuel hem de robot ticareti için ideal hale getirir. Atom Analisti, Piyasada Daha İyi Bir Avantaj Bulmak İçin Fiyatın Gücünü ve Momentumunu Kullanan PA Fiyat Hareketi Göstergesidir. Gürültüleri ve Yanlış Sinyalleri Kaldırmaya ve Ticaret Potansiyelini Artırmaya Yardımcı Olan Gelişmiş Filtrelerle Donatılmıştır. Birden fazla katmanlı karmaşık göstergeler kullanarak, Atom Analisti
Scalper Vault
Oleg Rodin
5 (27)
Scalper Vault , başarılı bir scalping için ihtiyacınız olan her şeyi size sağlayan profesyonel bir scalping sistemidir. Bu gösterge, forex ve ikili opsiyon tüccarları tarafından kullanılabilecek eksiksiz bir ticaret sistemidir. Önerilen zaman çerçevesi M5'tir. Sistem size trend yönünde doğru ok sinyalleri sağlar. Ayrıca size üst ve alt sinyaller ve Gann piyasa seviyeleri sağlar. Göstergeler, PUSH bildirimleri dahil her türlü uyarıyı sağlar. Göstergeyi satın aldıktan sonra lütfen benimle iletişim
TPSproTREND PrO
Roman Podpora
5 (15)
TPSpro TRENDPRO  - is a trend indicator that automatically analyzes the market and provides information about the trend and each of its changes, as well as giving signals for entering trades without redrawing! The indicator uses each candle, analyzing them separately. referring to different impulses - up or down impulse. Exact entry points into transactions for currencies, crypto, metals, stocks, indices!  -  Version MT5               DETAILED DESCRIPTION        /       TRADING SETUPS           
Trend Screener
STE S.S.COMPANY
4.83 (86)
Trend Göstergesi, Trend Alım Satım ve Filtreleme için Çığır Açan Benzersiz Çözüm, Tüm Önemli Trend Özellikleriyle Tek Bir Araç İçinde Yerleştirildi! Forex, emtialar, kripto para birimleri, endeksler ve hisse senetleri gibi tüm sembollerde/araçlarda kullanılabilen %100 yeniden boyamayan çoklu zaman çerçevesi ve Çoklu para birimi göstergesidir. Trend Screener, grafikte noktalarla ok trend sinyalleri sağlayan etkili bir trend trend göstergesidir. Trend analizörü göstergesinde bulunan özellikler: 1.
Tanıtım       Kuantum Trend Keskin Nişancı Göstergesi   , trend tersine dönmeleri belirleme ve ticaret yapma şeklinizi değiştiren çığır açan MQL5 Göstergesi! 13 yılı aşkın ticaret tecrübesine sahip deneyimli tüccarlardan oluşan bir ekip tarafından geliştirilmiştir.       Kuantum Trend Keskin Nişancı Göstergesi       trend dönüşlerini son derece yüksek doğrulukla belirlemenin yenilikçi yolu ile ticaret yolculuğunuzu yeni zirvelere taşımak için tasarlanmıştır. ***Kuantum Trend Keskin Nişancı Gö
Öncelikle, bu Ticaret Aracının Non-Repainting, Non-Redrawing ve Non-Lagging Gösterge olduğunu vurgulamakta fayda var, bu da onu profesyonel ticaret için ideal hale getiriyor. Akıllı Fiyat Hareketi Kavramları Göstergesi, hem yeni hem de deneyimli tüccarlar için çok güçlü bir araçtır. İleri ticaret fikirlerini, Inner Circle Trader Analizi ve Smart Money Concepts Ticaret Stratejileri gibi 20'den fazla kullanışlı göstergeyi bir araya getirerek bir araya getirir. Bu gösterge, büyük kurumların tica
ŞU ANDA %26 INDIRIMLI Yeni Başlayanlar veya Uzman Tüccarlar için En İyi Çözüm! Bu Gösterge benzersiz, yüksek kaliteli ve uygun fiyatlı bir ticaret aracıdır çünkü bir dizi tescilli özellik ve yeni bir formül ekledik. Sadece BİR grafik ile 28 Forex çifti için Döviz Gücünü okuyabilirsiniz! Yeni bir trendin veya scalping fırsatının tam tetik noktasını belirleyebildiğiniz için ticaretinizin nasıl gelişeceğini hayal edin? Kullanım kılavuzu: buraya tıklayın Bu ilk olan, orijinal! Değersiz bir
TPSpro RFI Levels
Roman Podpora
5 (13)
A key element in trading is zones or levels from which decisions to buy or sell a trading instrument are made. Despite attempts by major players to conceal their presence in the market, they inevitably leave traces. Our task was to learn how to identify these traces and interpret them correctly. Reversal First Impulse levels (RFI)   -  Version MT5                INSTRUCTIONS                 RUS                 ENG                                       R ecommended to use with an indicator   -  
Advanced Supply Demand
Bernhard Schweigert
4.92 (310)
CURRENTLY 26% OFF !! Best Solution for any Newbie or Expert Trader! This indicator is a unique, high quality and affordable trading tool because we have incorporated a number of proprietary features and a new formula. With this update, you will be able to show double timeframe zones. You will not only be able to show a higher TF but to show both, the chart TF, PLUS the higher TF: SHOWING NESTED ZONES. All Supply Demand traders will love it. :) Important Information Revealed Maximize the potenti
Entry Points Pro
Yury Orlov
4.7 (224)
Yeniden boyamadan bir ticarete girmek için doğru sinyaller sağlayan MT5 için en iyi gösterge! Herhangi bir finansal varlığa uygulanabilir: forex, kripto para birimleri, metaller, hisse senetleri, endeksler. MT5 versiyonu burada Oldukça doğru alım satım sinyalleri sağlayacak ve bir alım satımı açıp kapatmanın en iyi zamanını size söyleyecektir. Göstergeyi ödeyen yalnızca bir sinyali işleme örneğiyle videoyu (6:22) izleyin! Çoğu tüccar, Giriş Noktaları Pro göstergesinin yardımıyla ilk işl
Scalper Inside PRO
Alexey Minkov
4.75 (55)
SALE NOW! Limited Time Offer! An exclusive indicator that utilizes an innovative algorithm to swiftly and accurately determine the market trend. The indicator automatically calculates opening, closing, and profit levels, providing detailed trading statistics. With these features, you can choose the most appropriate trading instrument for the current market conditions. Additionally, you can easily integrate your own arrow indicators into Scalper Inside Pro to quickly evaluate their statistics and
Özel MT4 göstergemizle başarılı forex ticaretinin sırrını keşfedin! Forex piyasasında nasıl başarıya ulaşacağınızı hiç merak ettiniz, riski en aza indirirken sürekli olarak kar kazandınız mı? İşte aradığınız cevap! Ticaret yaklaşımınızda devrim yaratacak tescilli MT4 göstergimizi tanıtmamıza izin verin. Benzersiz çok yönlülük Göstergemiz, Renko ve RangeBar Mum oluşumlarını tercih eden kullanıcılar için özel olarak tasarlanmıştır. Bu grafik türlerinin birçok deneyimli tüccar tarafından ter
TrendMaestro
Stefano Frisetti
5 (2)
note: this indicator is for METATRADER4, if you want the version for METATRADER5 this is the link: TRENDMAESTRO recognizes a new TREND in the bud, he never makes mistakes. The certainty of identifying a new TREND is priceless. DESCRIPTION TRENDMAESTRO identifies a new TREND in the bud, this indicator examines the volatility, volumes and momentum to identify the moment in which there is an explosion of one or more of these data and therefore the moment in which prices have strong probability of f
Şu anda %20 İNDİRİMLİ! Herhangi bir Acemi veya Uzman Tüccar için En İyi Çözüm! Bu gösterge paneli yazılımı 28 döviz çifti üzerinde çalışıyor. Ana göstergelerimizden 2'sine (Gelişmiş Para Birimi Gücü 28 ve Gelişmiş Para Birimi Dürtüsü) dayanmaktadır. Tüm Forex piyasasına harika bir genel bakış sağlar. Gelişmiş Para Birimi Gücü değerlerini, para birimi hareket hızını ve tüm (9) zaman dilimlerinde 28 Forex çifti için sinyalleri gösterir. Trendleri ve / veya scalping fırsatlarını belirlemek içi
Mucizevi Forex Göstergesi Tanıtımı: Keskin Ticaretin Gücünü Serbest Bırakın Tüm zaman dilimlerinde gerçekten olağanüstü sonuçlar sunan en iyi Forex göstergesini aramaktan sıkıldınız mı? Artık aramayın! Mucizevi Forex Göstergesi, ticaret deneyiminizi devrimleştirip kazançlarınızı yeni zirvelere taşımak için burada. Gelişmiş teknoloji ve yılların özenli geliştirmesi temelinde Mucizevi Forex Göstergesi, döviz piyasasında güç ve keskinlik açısından doruğa çıkar. Bu olağanüstü araç, tüm seviyelerdeki
FX Power MT4 NG
Daniel Stein
5 (8)
Sabah Brifingimiz burada mql5 ve on Telegram! FX Power MT4 NG , uzun zamandır çok popüler olan döviz gücü ölçerimiz FX Power'ın yeni neslidir. Peki bu yeni nesil güç ölçer ne sunuyor? Orijinal FX Power hakkında sevdiğiniz her şey PLUS GOLD/XAU güç analizi Daha da hassas hesaplama sonuçları Ayrı ayrı yapılandırılabilir analiz dönemleri Daha da iyi performans için özelleştirilebilir hesaplama limiti Özel çokluDaha fazlasını görmek isteyenler için örnek ayarlar Her grafikte en sevdiğiniz renkler i
ÇOKLU PARA BİRİMİ ve ÇOK ZAMANLI ÇERÇEVE ALIM VE SATIŞ UYARISI. OTOMATİK TAKİP DURDURMA VE RİSK ÖDÜLÜ KÂR AL! GÖSTERGE TARAMALARI VE PİYASAYI ANALİZ ETMEK, YAPACAK BİR ŞEYİNİZ YOK! TÜM PARA BİRİMLERİNİZİ 1 GRAFİKTE İŞLEM YAPIN!   Satın aldıktan sonra lütfen yorum bırakın benimle iletişime geçin, size ticaret asistanı EA'yı göndereceğim. Gösterge, en iyi ONAYLANMIŞ giriş noktalarını bulmak için çeşitli Osilatörler ve ekli filtreler kullanıyor, bu nedenle bu konuda endişelenmenize gerek yok
Quantum Breakout Indicator PRO
Bogdan Ion Puscasu
4.96 (26)
Tanıtım       Quantum Breakout PRO   , Breakout Bölgeleri ile ticaret yapma şeklinizi değiştiren çığır açan MQL5 Göstergesi! 13 yılı aşkın ticaret deneyimine sahip deneyimli tüccarlardan oluşan bir ekip tarafından geliştirilen   Quantum Breakout PRO   , yenilikçi ve dinamik koparma bölgesi stratejisiyle ticaret yolculuğunuzu yeni zirvelere taşımak için tasarlanmıştır. Kuantum Breakout Göstergesi, size 5 kar hedefi bölgesi ile kırılma bölgelerinde sinyal okları ve kırılma kutusuna dayalı ol
PRO Renko Sistemi, RENKO grafikleri ticareti için özel olarak tasarlanmış son derece hassas bir ticaret sistemidir. Bu, çeşitli ticaret araçlarına uygulanabilen evrensel bir sistemdir. Sistemi etkin piyasa sana doğru ters sinyallerine erişim hakkı denilen ses nötralize eder. Göstergenin kullanımı çok kolaydır ve sinyal üretiminden sorumlu tek bir parametreye sahiptir. Aracı, seçtiğiniz herhangi bir ticaret aracına ve renko çubuğunun boyutuna kolayca uyarlayabilirsiniz. Yazılımımla karlı b
TrendDecoder Premium
Christophe, Pa Trouillas
5 (3)
Aralıkları ve bir sonraki olası hamleleri belirleyin   |  Trendlerin en erken sinyallerini ve gücünü alın   |  Geri dönüşten önce net çıkışlar alın   |  Fiyatın test edeceği Fibo seviyelerini tespit edin Gecikmesiz, takip edilmeyen gösterge - manuel ve otomatik ticaret için ideal - tüm varlıklar ve tüm zaman birimleri için uygun Sınırlı süreli teklif >>   %50 İNDİRİM Satın aldıktan sonra, kişiselleştirilmiş ayarlar için bu kanaldan benimle iletişime geçin . MT5   sürümü:   buraya tıklayın Tam y
Currency Strength Wizard , başarılı ticaret için size hepsi bir arada çözüm sağlayan çok güçlü bir göstergedir. Gösterge, birden çok zaman dilimindeki tüm para birimlerinin verilerini kullanarak şu veya bu forex çiftinin gücünü hesaplar. Bu veriler, şu veya bu para biriminin gücünü görmek için kullanabileceğiniz, kullanımı kolay para birimi endeksi ve para birimi güç hatları biçiminde temsil edilir. İhtiyacınız olan tek şey, işlem yapmak istediğiniz tabloya göstergeyi eklemektir ve gösterge size
Trend Forecasting
Mohamed Hassan
5 (15)
This indicator is unstoppable when combined with our other indicator called Katana. After purchase, send us a message and you could get Katana for FREE as a BONUS After purchase, send us a private message for your instructions.  MT5 version: click here There are limited copies available at $55. Next price is $105. Don't miss this great deal!  The Trend Forecasting indicator is a very unique & easy tool that is able to make prediction about future price movement based on the signal
ŞU ANDA %31 INDIRIMLI !!! Yeni Başlayanlar veya Uzman Tüccarlar için En İyi Çözüm! Bu gösterge benzersiz, yüksek kaliteli ve uygun fiyatlı bir ticaret aracıdır çünkü bir dizi tescilli özellik ve gizli bir formül ekledik. Yalnızca BİR grafikle 28 döviz çiftinin tümü için Uyarılar verir. Yeni bir trendin veya scalping fırsatının tam tetik noktasını belirleyebildiğiniz için ticaretinizin nasıl gelişeceğini hayal edin! Yeni temel algoritmalar üzerine inşa edilen bu sistem, potansiyel işlemler
FX Volume
Daniel Stein
4.6 (35)
Sabah Brifingimiz aracılığıyla ayrıntılar ve ekran görüntüleri ile günlük piyasa güncellemenizi alın burada mql5 ve on Telegram ! FX Volume, bir brokerin bakış açısından piyasa duyarlılığı hakkında GERÇEK bir fikir veren İLK ve TEK hacim göstergesidir. COT raporlarından çok daha hızlı bir şekilde, brokerlar gibi kurumsal piyasa katılımcılarının Forex piyasasında nasıl konumlandıklarına dair harika bilgiler sağlar. Bu bilgileri doğrudan grafiğinizde görmek, ticaretiniz için gerçek oyun değiştir
Shepherd Harmonic Pattern
Abdullah Alrai
4.68 (59)
Bu gösterge, manuel ve otomatik yöntemlerle çizilen harmonik desenleri algılar. Kullanım kılavuzuna şu bağlantıdan erişebilirsiniz: İncelemenizi ekleyin ve ürünü almak için bizimle iletişime geçin. Bu ürünü mt4'te denemek için ücretsiz bir sürümü vardır. Gartley ve Nenstar desenlerini algılamak için kullanabilirsiniz: https://www.mql5.com/en/market/product/30181 Tam MT4 sürümünü şuradan satın alabilirsiniz: https://www.mql5.com/en/market/product/15212 Notlar Gösterge kontrol paneline sahiptir ve
TakePropips Donchian Trend Pro
Eric John Pajarillaga Aldana
4.82 (17)
TakePropips Donchian Trend Pro   (MT4), Donchian Kanalı'nı kullanarak trendin yönünü otomatik olarak tespit eden ve size ticarete giriş ve çıkış sinyalleri sağlayan güçlü ve etkili bir araçtır! Bu çok işlevli gösterge, bir trend tarayıcı, ticaret sinyalleri, istatistiksel panel, tarayıcı, ticaret oturumları ve uyarı geçmişi panosu içerir. Size ticaret sinyalleri sağlamak ve çizelgeleri analiz ederek saatlerce tasarruf etmenizi sağlamak için tasarlanmıştır! Kullanım kılavuzunu ve kurulum kılavuzu
How to use Pair Trading Station Pair Trading Station is recommended for H1 time frame and you can use it for any currency pairs. To generate buy and sell signal, follow few steps below to apply Pair Trading Station to your MetaTrader terminal. When you load Pair Trading Station on your chart, Pair Trading station will assess available historical data in your MetaTrader platforms for each currency pair. On your chart, the amount of historical data available will be displayed for each currency pai
UPD1 Volume BOX
Vitaliy Kuznetsov
5 (14)
Gösterge, belirtilen alandaki (BOX) yatay hacim profilini ve maksimum hacmi (POC) görüntüler. Ürün Özellikleri. 1. Keneleri veya sadece fiyatı kullanabilirsiniz. 2. Uyarlanabilir ızgara aralığı (M1-MN). 3. Kutu boyutuna bağlı olarak uyarlanabilir yüksek hacimli (medyan) arama adımı. 4. Kutu çizgileri ve düğmeler için otomatik bukalemun rengi. 5. Çoklu kutular, oluşturulması ve silinmesi kolay. 6. %70 hacim alanı (ayarlardan etkinleştirilir). 7. Maksimum yatay hacim çizgisine (POC) dokunmak içi
RelicusRoad Pro
Relicus LLC
4.78 (139)
Şimdi 147 $ (birkaç güncellemeden sonra 499 $ 'a yükseliyor) - Sınırsız Hesaplar (PC'ler veya Mac'ler) RelicusRoad Kullanım Kılavuzu + Eğitim Videoları + Özel Discord Grubuna Erişim + VIP Durumu PİYASAYA BAKMAK İÇİN YENİ BİR YOL RelicusRoad, forex, vadeli işlemler, kripto para birimleri, hisse senetleri ve endeksler için dünyanın en güçlü ticaret göstergesidir ve yatırımcılara kârlı kalmaları için ihtiyaç duydukları tüm bilgileri ve araçları sağlar. Başlangıç ​​seviyesinden ileri seviyey
Yazarın diğer ürünleri
Profit MACD
Aleksey Ivanov
5 (2)
I present an indicator for professionals. ProfitMACD is very similar to classic MACD in appearance and its functions . However, ProfitMACD is based on completely new algorithms (for example, it has only one averaging period) and is more robust, especially on small timeframes, since it filters random price walks. The classic MACD indicator (Moving Average Convergence / Divergence) is a very good indicator following the trend, based on the ratio between two moving averages, namely the EM
Identify Trend
Aleksey Ivanov
4.25 (32)
The Identify Trend indicator, using fairly simple but robust filtering methods (based on the moving median – algorithm XM )  and more complex algorithms (XC, XF, XS, four types of non-lagging moving averages   SMAWL, EMAWL,  SSMAWL, LWMAWL ) developed by the author , allows determined (1) the beginning of a true trend movement very precisely and, most importantly, with a small delay, and (2) identifying the flat. Such an indicator can be used for trading scalper strategies as well
FREE
Scientific trade
Aleksey Ivanov
5 (1)
An extremely convenient indicator that truly makes the process of making money on the exchange easy. It is based on the scientifically rigorous theory of the market developed by the author, the beginning of which is presented here .                The full algorithm of this indicator operation is presented in the article .               The indicator calculates the most probable price movement trajectory and displays it on the chart. Based on the predicted price movement trajectory
TrueChannel
Aleksey Ivanov
5 (7)
The TrueChannel   indicator shows us the true price movement channels. This indicator resembles Donchian Channel   in its appearance, but is built on the basis of completely different principles and gives (in comparison with Donchian Channel , which is better just to use to assess volatility) more adequate trading signals.              As shown in the article , the price actually moves in channels parallel to the time axis and jumps abruptly from the previous channels to the subsequ
FREE
Absolute Bands
Aleksey Ivanov
4.5 (4)
Principles of construction of the indicator.               The Absolute Bands (AB) indicator is reminiscent of the Bollinger Bands indicator with its appearance and functions, but only more effective for trading due to the significantly smaller number of false signals issued to them. This effectiveness of the Absolute Bands indicator is due to its robust nature.               In the Bollinger Bands indicator, on both sides of the moving average - Ma, there are lines spaced from Ma by the standa
FREE
Quality trend
Aleksey Ivanov
5 (1)
The Quality trend indicator expresses the ratio of the strength of a trend or the speed of its growth (fall) to the degree of its noisiness or a certain norm of amplitudes of chaotic fluctuations of a growing (falling) price. The position of the indicator line above zero shows an increasing trend, below zero - a falling trend, the fluctuation of the indicator line near zero shows a flat. If the indicator line begins to fluctuate rapidly around zero and approach it, then this indica
Casual Channel
Aleksey Ivanov
5 (1)
Grafiklerde gördüğünüz trendler her zaman kazanılabilecek trendler değildir. İki tür eğilim vardır:  1)   istikrarlı olan ve bu nedenle tüccar için güvenilir bir kâr sağlayabilen temel ekonomik nedenlerin neden olduğu gerçek eğilimler;  2)    sadece bir trend gibi görünen ve rastgele olaylar zinciri nedeniyle ortaya çıkan yanlış trend bölümleri - fiyatı (esas olarak) tek yönde hareket ettirmek. Bu yanlış trend bölümleri kısadır ve her an yönünü tersine çevirebilir.;  bu nedenle, ya
The Signal Envelopes   indicator uses the robust filtering method based on: (1) the moving median Buff0 = <Median> = (Max {x} + Min {x}) / 2 and (2) the averaging algorithm developed by the author Buff1 = <(<Median> ) ^ (- 3)> * (<Median>) ^ 4  based on the moving median. The Signal Envelopes   indicator allows you to most accurately and with the minimum possible delay set the beginning of a new trend.  The Signal Envelopes indicator can be used both for trading according to scalpe
Iterative Moving Average – IMA.   IMA is obtained by correcting the usual   MA.   The correction consists in addition   to MA averaged difference between the time series (X) and its MA, i.e.   IMA(X)=MA(X) + MA ( Х -MA(X)). Correction is done in several iterations (and, exactly, 2 iterations in this indicator) and with a change in the averaging period.               As a result, the time-series points begin to cluster around (on all sides) of the getting   IMA and with a smaller de
Alligator Analysis
Aleksey Ivanov
4.75 (4)
Indicator description.            The “ Alligator Analysis ” ( AA ) indicator allows you to build various (by averaging types and by scales) “ Alligators ” and their combinations, i.e. allows you to analyze the state of the market based on the correlation of this state with a whole range of different " Alligators ".  The classic " Alligator " by Bill Williams is based on moving averages and Fibonacci numbers, which makes it one of the best indicators now. The classic " Alligator "   is based on
FREE
Firstly , the script estimates how many Mx bars of the chart (on which this script is applied) the future trend will most likely continue and what is its quality. Secondly (and most importantly), the script is an auxiliary tool for the extremely mathematically advanced and extremely effective ScientificTrade indicator in trading. The script calculates the optimal averaging period, which is also equal to Mx, of the ScientificTrade indicator, which gives the maximum profit according to the strate
The Identify Market State   indicator allows you to set the beginning of a new trends and pullbacks on an existing trend. This indicator can be used both for trading on scalper strategies and for long-term trading strategies.               The indicator is based on the 14 periodic DeMarker   indicator and the 8 periodic simple moving average from this indicator. Statistical studies have shown that the sharp peaks of the DeMarker   indicator curve when they drop below its minimum li
The principle of constructing indicator lines .               Profit Trade  indicator is very effective for trading. Profit Trade  is a deep development of the well-known Donchian channel  indicator. The upper (BlueViolet color) Dup and the lower (IndianRed) Ddn lines of the indicator are constructed in the same way as in the Donchian channel , based on the highest (high of High) and lowest (low of Low) prices for the previous n1 = 20 periods. The middle line (Gold) Dm is constructed in the sam
The indicator visualizes the result of the   CalculateScientificTradePeriod    script (which, of course, also needs to be downloaded), which, firstly , estimates how many Mx bars of the active chart the future trend will most likely continue and what is its quality, and, secondly , calculates the optimal the averaging period (which is also equal to Mx) of the ScientificTrade   indicator, which gives the maximum profit according to the extremely effective   ScientificTrade strategy. For the FindS
Channel Builder
Aleksey Ivanov
4.67 (6)
The Channel Builder (CB) or Ivanov Bands indicator is a broad generalization of the Bollinger Bands indicator. First, in CB, the mean line <X> is calculated using various averaging algorithms. Secondly, the mean deviations calculated by Kolmogorov averaging are plotted on both sides of the middle line <X>.                The middle line <X>, besides the standard SMA, EMA, SMMA and LWMA averaging algorithms, can be Median = (Max + Min) / 2 sliding median (which is the default). In
FREE
Asummetry
Aleksey Ivanov
The principle of the indicator.                             The Asummetry  indicator allows you to predict the beginning of a change in the direction of trends, long before their visual appearance on the price chart.               The author statistically revealed that before changing the direction of the trend, the probability distribution function of the price is made as asymmetric as possible. More precisely, the price movement in any direction always pulls sideways the function of its dis
PDP indicator is used for: defining price probability distributions. This allows for a detailed representation of the channel and its borders and forecast the probability of a price appearing at each segment of its fluctuations; defining the channel change moment. Operation principles and features PDP analyzes a quote history on lower timeframes and calculates a price probability distribution on higher ones. Forecast algorithms allow the indicator to calculate probability distributions and m
Signal Bands is a sensitive and convenient indicator, which performs deep statistical processing of information. It allows to see on one chart (1) the price trend, (2) the clear price channel and (3) latent signs of trend change. The indicator can be used on charts of any periods, but it is especially useful for scalping due to its high sensitivity to the current market state. The functions of the indicator : First, the Signal Bands indicator draws channels into which all price fluctuations ex
Structure of the indicator.               The Cunning crocodile indicator consists of three moving averages (applied to the price   Median price   = (high + low)/2 ) :   1) the usual MA ( SMA , EMA , SMMA ,   LWMA )  or the mean <X> of the process X and her two generalizations 2) <XF> = <X / <X >> * <X> and 3) <XS> = <X * <X >> / <X> with the same averaging period. All three curves intersect at common points that (such an intersection in which the cunning crocodile, unlike the usual one, "never
Sensitive Signal
Aleksey Ivanov
5 (2)
The Sensitive Signal ( SS ) indicator, using the filtering methods  (which includes cluster multicurrency analysis) developed by the author, allows, with a high degree of probability, to establish the beginning of the true (filtered from interference - random price walks) trend movement. It is clear that such an indicator is very effective for trading on the currency exchange , where signals are highly distorted by random noise. The filtration developed by the author is carried out
The principle of the indicator.               A simple moving average (SMA) with an averaging period (2n + 1) of bars is always obtained lagging by n bars. If SMA or other types of moving averages are the basis for making trading decisions, then their strong delay does not allow   to open positions in time and close positions, which leads to losses.                            The Estimation moving average without lag ( EMAWL ) indicator calculates the non-lagging moving average, which is calcula
The principle of the indicator.               The Strong Trend Flat Signal (STFS) indicator is the intersection of two, developed by the author, non-lagging moving averages with averaging periods 21 and 63.               A simple moving average (SMA) with an averaging period (2n + 1) of bars is always obtained lagging by n bars. If SMA or other types of moving averages are the basis for making trading decisions, then their strong delay does not allow  to open positions in time and close positi
Introduction.             The indicator predicts the price in accordance with the prevailing trend  and its own small statistical price fluctuations around this trend. At the same time, in StatPredict , you need to set the time horizon of the forecasted events, which is set by the parameter settings of the “ Length of forecast in bars ” indicator and determined by the characteristic time scale of the current   trend, which is best measured by the ProfitMACD indicator or by the previous price co
Indicator is used for: defining price probability distributions. This allows for a detailed representation of the channel and its borders and forecast the probability of a price appearing at each segment of its fluctuations; defining the channel change moment.   Operation principles and features Indicator analyzes a quote history on lower timeframes and calculates a price probability distribution on higher ones. Forecast algorithms allow the indicator to calculate probability distributions and m
The principle of constructing indicator lines and their meaning .               The Signal Channel   indicator uses a robust filtering method based on two moving medians applicable to the High and Low prices, i.e. the lines <High> and <Low>, where <..> is the sign of linear averaging, which are shifted by certain values ​​in an uptrend and by opposite values ​​in a downtrend, which allows you to get a narrow channel, approximately outlining each bar. Sharp kinks of the lines of such a channel a
Robust Filter
Aleksey Ivanov
5 (1)
The Robust filter   indicator is based on the robust filtering algorithm developed by the author using the multi-period averaged moving median. The algorithm for this averaging is shown in the last screenshot.                The indicator calculates and shows: 1. The direction of the trend; 2. Entry and exit points of positions; 3. StopLoss   lines calculated from current price probability distributions and selected probability of closing an order by StopLoss before the trend revers
This   indicator is intended for professionals assessing fundamental market trends.  This indicator calculates the index of any instrument and analyzes it.              The index of the state currency shows the real purchasing power of this currency, and the dynamics of this index shows the dynamics of the economic state of the corresponding state. An analysis of the indices of both currencies included in a currency pair makes it much more reliable to identify the trend of this cur
The Multicurrency Trend Detector ( MTD ) indicator allows you to immediately and on one chart on a selected time interval (extending from a zero bar to a bar set in the settings by the value horizon) determine the presence, direction and strength of trends in all major currencies, as well as assess the reliability of these trends.               This is achieved by calculating indices (non-relative purchasing power) of eight major currencies, namely: AUD, CAD, CHF, EUR, GBP, JPY, NZ
StatZigZag
Aleksey Ivanov
The StatZigZag  indicator looks like a regular ZigZag , but is built on the basis of completely different algorithms. The StatZigZag  indicator is a broken line built from segments of regression lines of different lengths, the beginning of each of which comes from the end of the previous segment. Each regression segment is built until the variance or spread of price around it begins to exceed a certain critical value, after which the construction of this segment ends and the constr
The Velocity of price change   ( VP ) indicator shows the average rate of price change at those characteristic time intervals where this rate was approximately constant. The robust algorithm used in VP   to smooth out the price from its random jumps, ensures the reliability of the indicator reading, which does not react to simple price volatility and its insignificant movements.             The indicator allows you to track trends and the moments of their reversals , during which t
Filtrele:
Aravind Kolanupaka
8820
Aravind Kolanupaka 2019.06.09 02:03 
 

Good indicator.

İncelemeye yanıt
Sürüm 1.20 2019.09.04
Improved code reliability.
Sürüm 1.10 2019.05.21
Improved algorithm for calculating standard deviation without delay