Square of 9 for all
- Indikatoren
-
Francesco Rubeo
 Minerva Management is a company composed by software engineers, especially in MQL4 by 6 years, and 6 years experienced traders.
 - Version: 1.1
- Aktualisiert: 29 April 2019
- Aktivierungen: 20
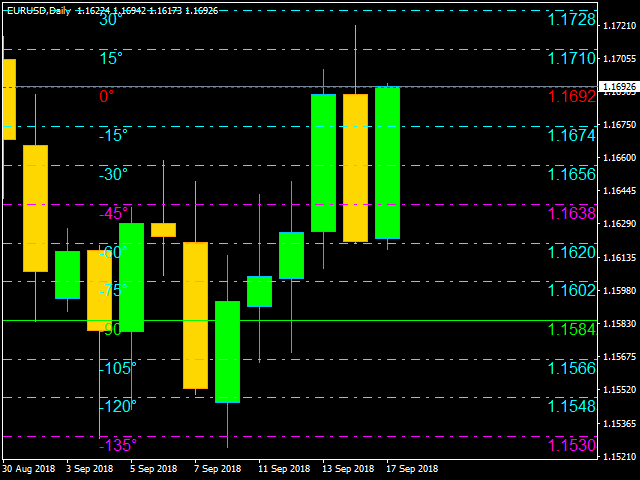
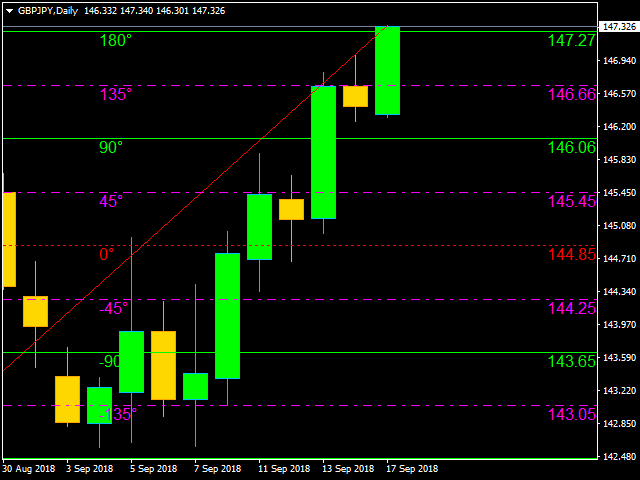
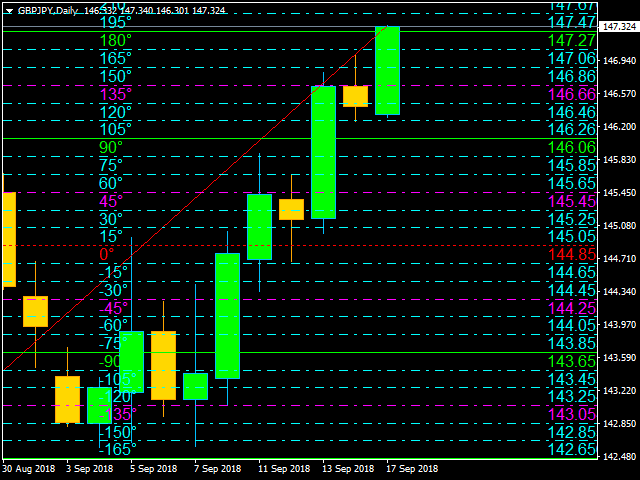
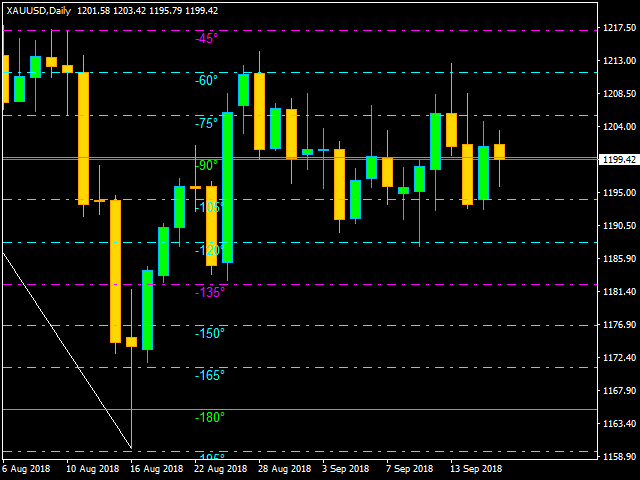
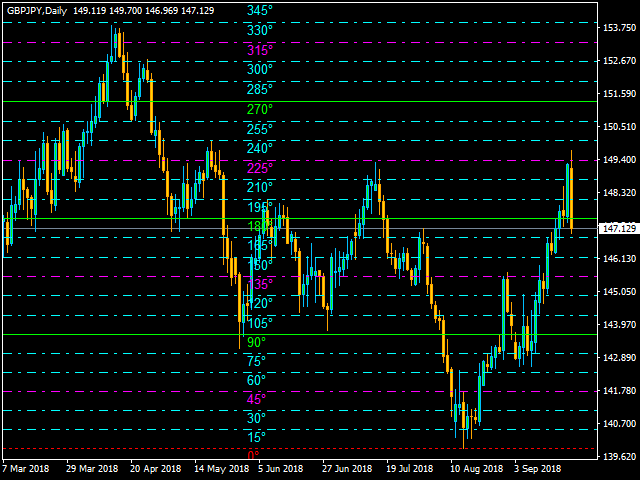
Willkommen zum berühmten "Quadrat der 9" von Gann!
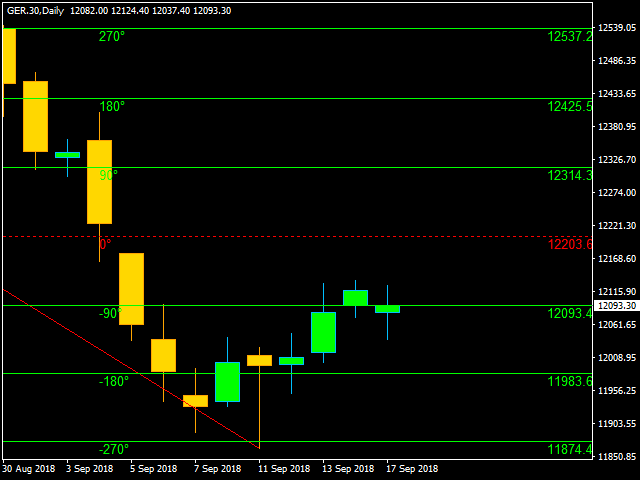
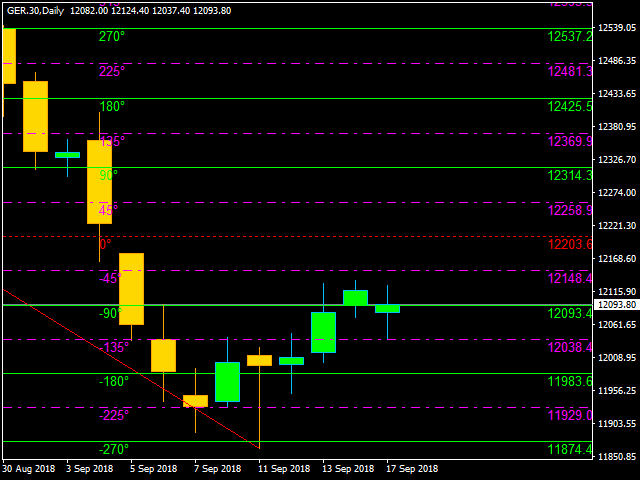
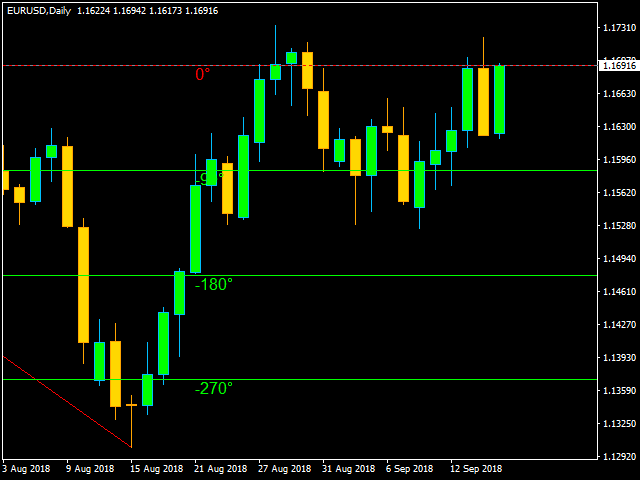
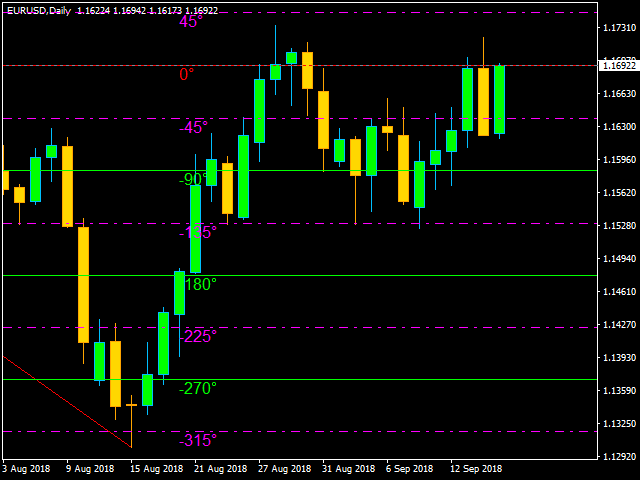
Diese Methode wurde von einem der besten Trader in der Geschichte verwendet, einer Person, die ihren Weg unter die Top-Trader gemacht hat. Ein "Heiliger Gral" für jeden, der den Handel erlernen möchte. Das "Quadrat der 9" wurde von diesem Genie verwendet, um die zukünftigen Unterstützungen und Widerstände des Marktes zu finden. Heutzutage ist es möglich, diese mit einem Klick zu finden, dank der Software. Damals benutzte Gann nur sein Quadrat und sein Goniometer!! Gann beschreibt diese Technik teilweise in seinem Buch "45 years in wall street". "Eine der größten Entdeckungen, die ich je gemacht habe, war, wie man den Prozentsatz der Höchst- und Tiefstkurse von Durchschnittswerten und einzelnen Aktien ermitteln kann. Der prozentuale Anteil der extremen Hoch- und Tiefstände zeigt zukünftige Widerstandsniveaus an" (45 Jahre an der Wall Street, Seite 30). Als Gann handelte, hatten die Kurse einen geringeren Wert als heute. Das bedeutet, dass sich das "magische Goniometer" an den heutigen Markt anpassen muss. Die Anpassung erfolgt über eine Variable namens K, die die Formel "Quadrat von 9" modifiziert und sich auf den Marktpreis selbst bezieht. Mit diesem Indikator ist es möglich, die "Key-Variable" automatisch zu verwenden oder sie manuell zu ändern, indem man "Allow Automatic K" auf false setzt. P.N.: Je niedriger der Kurswert ist, desto mehr müssen Sie den K-Wert verbessern. Der K-Wert muss reduziert werden, indem man ihn durch zehn teilt oder verbessert, indem man ihn mit zehn multipliziert. Gann schlägt vor, das Quadrat von 9 auf die letzte Bewegung des Marktes anzuwenden. Mit diesem Indikator können Sie entweder den letzten oder den vorhergehenden Swing analysieren, da sich in den meisten Fällen der aktuelle Swing (der letzte) noch in der Entstehung befindet. Aus diesem Grund zeichnet der Indikator auch die Bewegung, die analysiert wird, basierend auf den Swing-Einstellungen. Sie können den Medianpreis, einen gewichteten Preis des letzten Punktes (gewichteter Preis), den Minimalpreis des Swings (Minimum), den Maximalpreis des Swings (Maximum) verwenden oder manuell einen Startpreis (0°) festlegen. Die von Gann verwendeten "Square of 9"-Levels waren insbesondere die letzten, die Sie in den Eingabeparametern finden können (90°180°270°360°).
Eingangsparameter:
- Abweichung: Abweichung zur Berechnung des Schwungs;
- Zu analysierende Welle: Wählen Sie die zu analysierende Schwingung aus. Sie können zwischen der letzten und der vorherigen Schwingung wählen;
- Wellenfarbe: Wählen Sie die Farbe des Schwungs;
- Wellen-Stil: Wählen Sie die Schwingungsbreite;
- Quadrat von 9 0°Preis: Wählen Sie den Median, den gewichteten Preis, das Minimum des Schwungs, das Maximum des Schwungs oder stellen Sie ihn manuell ein;
- Set 0° By User: Wählen Sie Ihren bevorzugten 0°-Preis (Startpreis für das 9er-Quadrat);
- Anzuzeigende Zeit: Wählen Sie Ihren bevorzugten Zeitrahmen für die Analyse des 9er Quadrats;
- Allow Automatic K: wenn true, wird der K-Wert automatisch eingestellt; wenn false, wird der K-Wert manuell vom Benutzer eingestellt;
- K-Wert: Fügen Sie den K-Wert ein, wenn Sie bei Automatisches K zulassen die Option false wählen;
- Schriftart: Wählen Sie Ihre bevorzugte Schriftart;
- Levels Schriftgröße: Wählen Sie Ihre bevorzugte Schriftgröße für Ebenen;
- Werte Schriftgröße: Wählen Sie Ihre bevorzugte Schriftgröße für die Preise;
- 0°Sichtbar: Wählen Sie, ob die 0-Ebene sichtbar sein soll oder nicht;
- 0° Farbe: Wählen Sie Ihre bevorzugte Farbe für die 0-Ebene;
- 0° Stil: Wählen Sie Ihren bevorzugten Stil für die 0-Ebene;
- 18°36°54°etc. anzeigen: Wählen Sie, ob 18°36°54°etc. angezeigt werden sollen oder nicht;
- 18°36°54°etc.Farbe: Wählen Sie Ihre bevorzugte Farbe für 18°36°54°etc.Ebenen;
- 18°36°54°etc.Stil: Wählen Sie Ihren bevorzugten Stil für die Ebenen 18°36°54°etc;
- 15°30°60°etc. anzeigen: Wählen Sie, ob 15°30°60°etc. angezeigt werden sollen oder nicht;
- 15°30°60°etc.Farbe: Wählen Sie Ihre Lieblingsfarbe für die 15°30°60°etc.-Ebenen;
- 15°30°60°etc.Stil: Wählen Sie Ihren bevorzugten Stil für die 15°30°60°etc.-Stufen;
- 45°135°225°315° anzeigen: Wählen Sie, ob die 45°135°225°315°-Ebenen angezeigt werden sollen oder nicht;
- 45°135°225°315°Color: Wählen Sie Ihre Lieblingsfarbe für 45°135°225°315°-Ebenen;
- 45°135°225°315° Stil: Wählen Sie Ihren bevorzugten Stil für die 45°135°225°315°-Ebenen;
- 90°180°270°360° anzeigen: Wählen Sie, ob 90°180°270°360°-Ebenen angezeigt werden sollen oder nicht;
- 90°180°270°360°Color: Wählen Sie Ihre Lieblingsfarbe für 90°180°270°360°-Ebenen;
- 90°180°270°360° Stil: Wählen Sie Ihren bevorzugten Stil für 90°180°270°360° Stufen;