Gann Swing Chart Range
- Indikatoren
-
Francesco Rubeo
 Minerva Management is a company composed by software engineers, especially in MQL4 by 6 years, and 6 years experienced traders.
 - Version: 1.0
- Aktivierungen: 20
| Mit diesem Indikator erhalten Sie eine allgemeine Ablesung der Marktspanne unter Verwendung der Gann-Berechnungsmodi. |
|---|
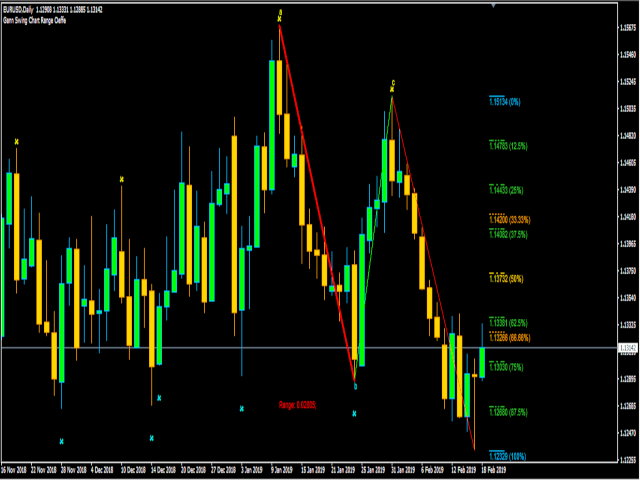
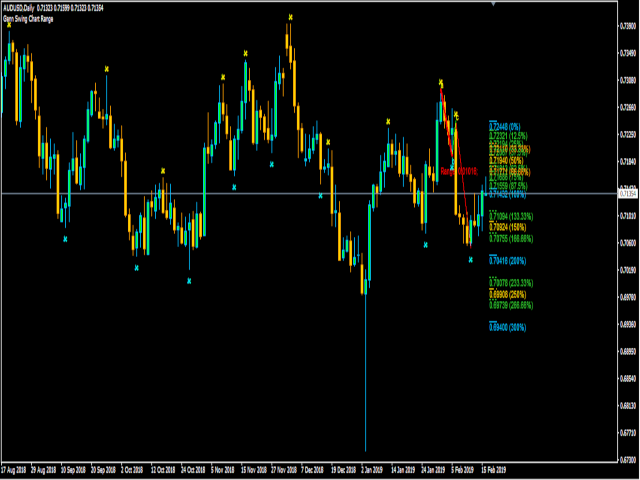
Der Gann-Swing wird verwendet, um die letzten Marktbewegungen auf den ersten Blick zu erkennen.
Die Grundlage dieser Swing-Berechnung ist die Anzahl der Kerzen in Bezug auf die Auf- und Abwärtsbewegung des Kurses. Wenn der Kurs das letzte Maximum nach oben durchbricht, wird der Swing nachgezeichnet, wenn eine bestimmte Anzahl von Kerzen vom letzten Minimum überschritten wird.
Es kann ein "reiner Gann" verwendet werden oder nicht: Wenn er auf "true" eingestellt ist, berücksichtigt der Indikator die Innenstäbe bei der Zählung nicht; wenn er auf "false" eingestellt ist, berücksichtigt der Indikator die Innenstäbe bei der Zählung.
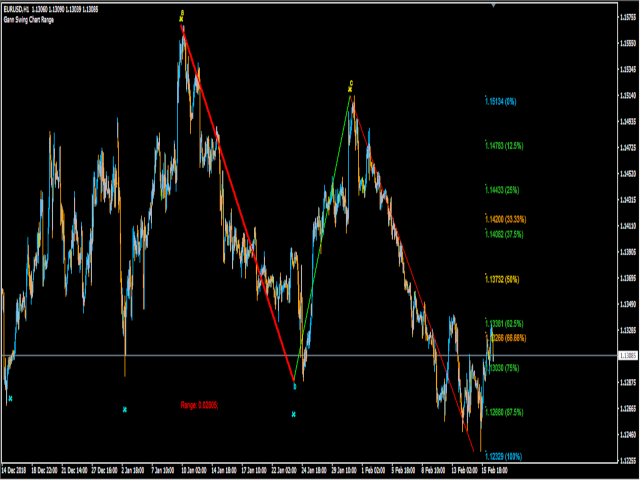
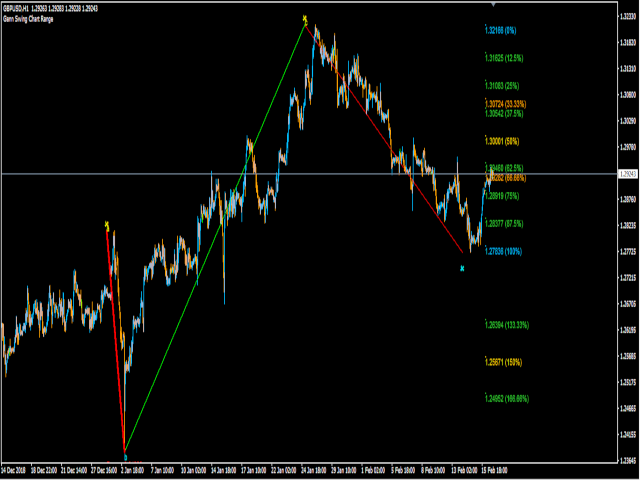
Dieser Indikator wird Ihnen auch beim "Lesen" des Schwungs sehr helfen:
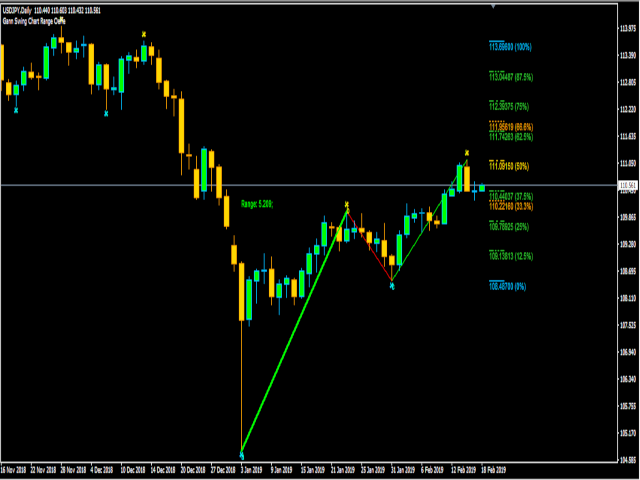
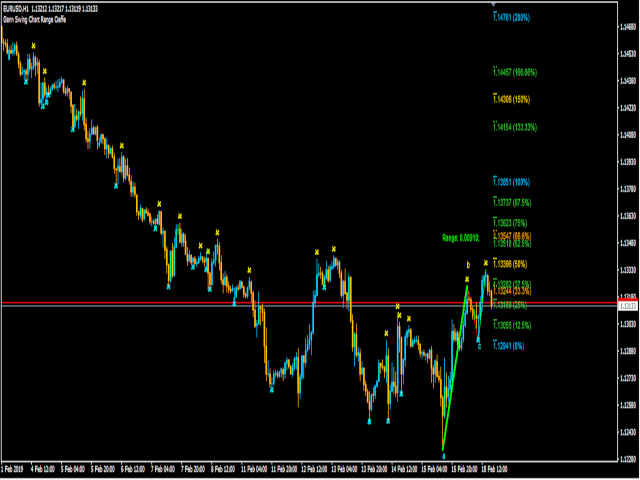
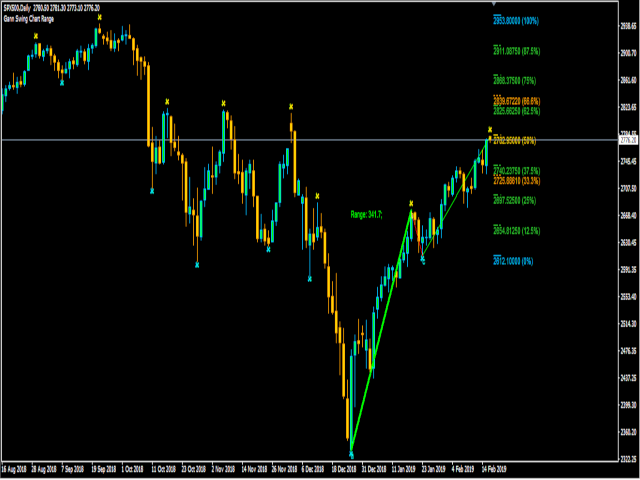
Die letzten drei Schwünge werden hervorgehoben, damit sie das letzte ABC bilden können.
Er wird Sie darüber informieren, aus wie vielen Punkten sich die Spanne zusammensetzt.
Er gibt Ihnen die Preise an, auf die sich der Preis stützt, und zwar auf der Grundlage der Schwankungen selbst.
Eingabeparameter:
Anzuzeigende Zeit: Zeitrahmen, auf den der Indikator angewendet wird
Balken Schwingen: Anzahl der Bars, auf denen die Zählung für die Swing-Formation ausgearbeitet wird.
Swing Width: Breite der Linien, die das ABC darstellen.
Arrow Down Color: Farbe der Kreuze oben
Farbe des Pfeils nach oben: Farbe der Kreuze nach unten
Farbe Kauf: Farbe des Schwungs nach oben (ABC)
Farbe des Verkaufs: Farbe des Abwärtsschwungs (ABC)
Use Pure Gann: Wenn true, wird reines Gann verwendet (kein Inside)
Schriftgröße: Größe der Schrift in der Grafik
Schriftart: Typ der Schriftart in der Grafik