XR Power Trend

1

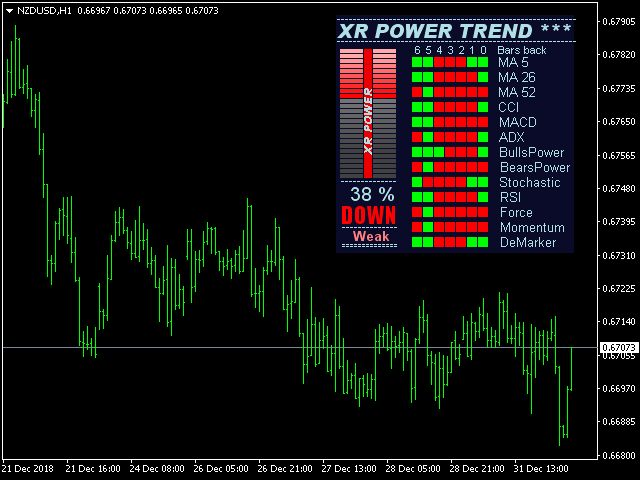
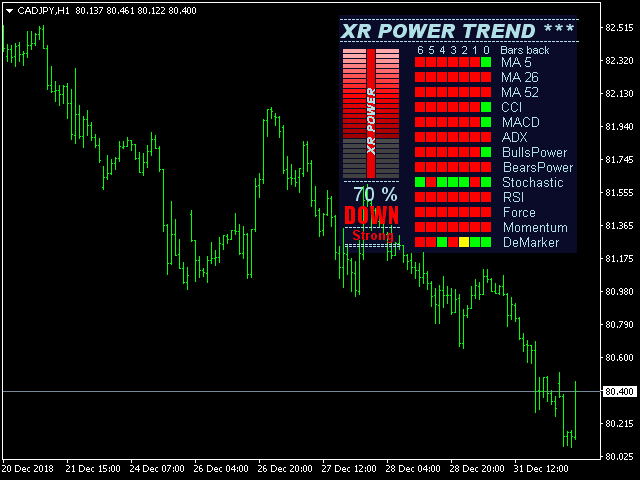
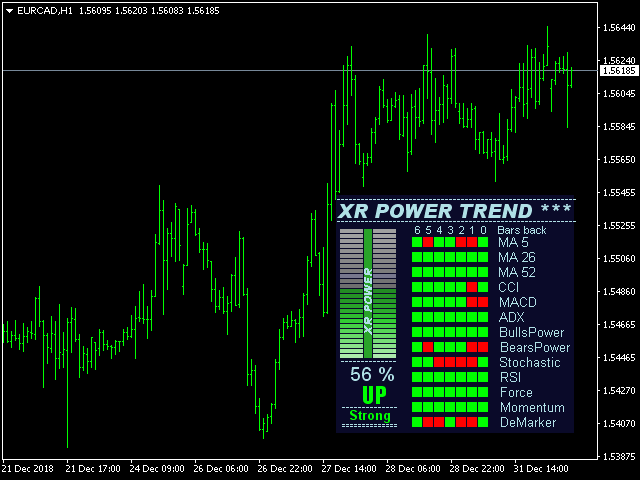
This indicator displays XR Power Trend movement.Indicator displays Moving Average period 5,Moving Average period 26,Moving Average period 52,Commodity Channel Index,MACD,Average Directional Movement Index,Bulls Power,Bears Power,Stochastic Oscillator,Relative Strength Index,Force Index,Momentum,DeMarker,average movement.Indicators period is standard period.


Features

  • X - move the trend left and right.
  • Y - move the trend up and down.

How to understand the status:

  • If the Trend color is green, trend is up.
  • If the Trend color is red, trend is down.

Produits recommandés
The indicator detects and displays М. Gartley's Butterfly pattern. The pattern is plotted by the extreme values of the ZigZag indicator (included in the resources, no need to install). After detecting the pattern, the indicator notifies of that by the pop-up window, a mobile notification and an email. The pattern and wave parameters are displayed on the screenshots. The default parameters are used for demonstration purposes only in order to increase the amount of detected patterns. Parameters z
The indicator detects and displays Shark harmonic pattern (see the screenshot). The pattern is plotted by the extreme values of the ZigZag indicator (included in the resources, no need to install). After detecting the pattern, the indicator notifies of that by a pop-up window, a mobile notification and an email. The indicator highlights the process of the pattern formation and not just the complete pattern. In the former case, it is displayed in the contour triangles. After the pattern is comple
KDJ Index 4   交易实用必备工具指标 波浪自动计算指标,通道趋势交易 完美的趋势-波浪自动计算通道计算 , MT4版本 完美的趋势-波浪自动计算通道计算 , MT5版本 本地跟单复制交易 Easy And Fast Copy , MT4版本 Easy And Fast Copy , MT5版本 本地跟单复制交易 模拟试用 Easy And Fast Copy , MT4 模拟账号运行 Easy And Fast Copy , MT5 模拟账号运行 "Cooperative QQ:556024  "  "Cooperation wechat:556024"  "Cooperative email:556024@qq.com" 强烈推荐趋势指标, 波浪的标准自动计算   和   波浪的标准自动计算MT5版本     KDJ指标又叫 随机指标 ,是一种相当新颖、实用的技术分析指标,它起先用于期货市场的分析,后被广泛用于股市的中短期趋势分析,是期货和股票市场上最常用的技术分析工具。 随机指标KDJ一般是用于股票分析的统计体系,根据统计学原理,通过一个特定的周期(常为9日、9周等)
The indicator detects and displays 3 Drives harmonic pattern (see the screenshot). The pattern is plotted by the extreme values of the ZigZag indicator (included in the resources, no need to install). After detecting the pattern, the indicator notifies of that by a pop-up window, a mobile notification and an email. The indicator highlights the process of the pattern formation and not just the complete pattern. In the former case, it is displayed in the contour triangles. After the pattern is com
Alpha Trend sign est notre outil de Trading très populaire depuis longtemps, il valide notre système de Trading et invite clairement les signaux de Trading sans dérive. Fonctions principales: • En fonction de la zone active du marché, selon les indicateurs, il est intuitif de déterminer si le cours actuel appartient à la tendance ou à la tendance. Et coupez le marché selon les flèches d'indication de l'indicateur, les flèches vertes suggèrent d'acheter et les flèches rouges suggèrent de vend
Charles Henry Dow felt that if the industrial average and the railroad average both moved in the same direction, it meant that a meaningful economic shift was occurring. In brief, this indicator bases on the Dow's theory. It can create an index of market symbols, almost anythings index. For example: Index of the Euro, Index of the Great Britain Pound, Index of the Japanese Yen, Index of the Swiss Franc, Index of the Gold, Index of the New Zealand Dollar, Index of the Australian Dollar, Index of
Nice Trade Point
Muhammed Emin Ugur
This    Nice Trade Point     indicator is designed for signal trading. This indicator generates trend signals. It uses many algorithms and indicators to generate this signal. It tries to generate a signal from the points with the highest trend potential. This indicator is a complete trading product. This indicator does not need any additional indicators. The indicator certainly does not repaint. The point at which the signal is given does not change.     Features and Suggestions Time Frame
This indicator is the undisputed leader among the indicators. And for this statement there is a good reason. The indicator builds a very high quality channel in which it generates signals to enter! What is the ideal strategy for the trader, since the trader always hesitates when choosing a strategy for the job. That is, this indicator will allow you to solve the dilemma of choosing a job by trend or to the channel, since it combines these two basic concepts. Working with the indicator is very
Charles Henry Dow felt that if the industrial average and the railroad average both moved in the same direction, it meant that a meaningful economic shift was occurring. In brief, this indicator bases on the Dow's theory. It can create an index of market symbols, almost anythings index. For example: Index of the Euro, Index of the Great Britain Pound, Index of the Japanese Yen, Index of the Swiss Franc, Index of the Gold, Index of the New Zealand Dollar, Index of the Australian Dollar, Index of
The   Trendlines Oscillator   helps traders identify trends and momentum based on the normalized distances between the current price and the most recently detected bullish and bearish trend lines. The indicator features bullish and bearish momentum, a signal line with crossings, and multiple smoothing options. USAGE The   Trendlines Oscillator   works by systematically: Identifying pivot highs and lows. Connecting pivots to form bullish (support) and bearish (resistance) trendlines. Measuring
Quants HL Break
Ferhat Mutlu
5 (2)
Calcul avancé effectué par l'action pure des prix pour trouver les cassures LH et HL. Cela vous donnera d'excellents points d'inversion sur le marché.Les signaux LH et HL peuvent également être utilisés pour les évasions de traingle. Une fois que la cassure se produit, cela indique un fort renversement.Beau filtre pour les moyennes mobiles.Je suggère fortement de l'utiliser avec des indicateurs de tendance. Peut être utilisé comme une confirmation supplémentaire pour le support et la résistanc
L'Indice Directionnel Moyen (ADX) Scanner Multidevises MT4 est un indicateur de trading avancé conçu pour analyser plusieurs paires de devises simultanément. Il bénéficie aux traders cherchant à améliorer leur processus de prise de décision en fournissant des signaux en temps réel basés sur l'Indice Directionnel Moyen, permettant une analyse efficace des tendances du marché. Cet outil simplifie l'expérience de trading en facilitant l'identification de la force des tendances et du mouvement direc
This indicator is based on the Bollinger Bands on one or more timeframes and on any Currency Cross Pair. The indicator generates an alert message when it detects a buy or sell signal. It also draws a vertical bar on the price chart: green for buy or red for sell, white if flat. Alert messages and Vertical bars for BUY or SELL, are generated when the Bollinger Bands is consistent for all chosen timeframes else a FLAT signal is generated. In addition, the Multi TimeFrames Bollinger Bands Signals i
Price Magnet — Price Density and Attraction Levels Indicator Price Magnet is a professional analytical tool designed to identify key support and resistance levels based on statistical Price Density. The indicator analyzes a specified historical period and detects price levels where the market spent the most time. These zones act as “magnets,” attracting price action or forming a structural base for potential reversals. Unlike traditional Volume Profile tools, Price Magnet focuses on price-time d
Delta Fusion Pro
Francesco Secchi
5 (2)
Delta Fusion Pro – Analyse Avancée du Flux d’Ordres pour le Trading Intraday Delta Fusion Pro est un indicateur professionnel pour MetaTrader 4 qui révèle le flux des ordres agressifs, en affichant l’intensité et la direction de la pression institutionnelle en temps réel. Contrairement aux indicateurs volumétriques traditionnels, il analyse la delta entre les volumes Ask et Bid afin d’anticiper les retournements, confirmer les tendances et identifier les zones d’intérêt professionnel. Caractér
Based on MACD indicator waves with standard parameters Applies Fibonacci levels to the last two MACD waves, positive and negative respectively, if at the moment the MACD indicator runs out of negative Wave - the color is green, if at the moment the MACD indicator runs out of positive Wave - the color is red. The Wave termination criterion is two ticks with a different MACD sign. Applies trend lines on the last four MACD Waves. Works well with the expert Figures MACD   https://www.mql5.com/ru/mar
The Range Directional Force Indicator is designed to help traders analyze market trends, reversals, and directional strength. It focuses on price movements within defined ranges, identifying key moments when the market is gaining momentum or preparing for a shift. By dividing the chart into dynamic price ranges, the indicator detects critical support and resistance levels. It calculates the directional force of price movements, highlighting potential entry and exit points based on market sentim
Crypto_Forex Indicator HTF Ichimoku pour MT4. - L'indicateur Ichimoku est l'un des indicateurs de tendance les plus puissants. HTF signifie - Higher Time Frame. - Cet indicateur est excellent pour les traders de tendance ainsi que pour la combinaison avec les entrées Price Action. - L'indicateur HTF Ichimoku vous permet d'attacher Ichimoku d'une période plus élevée à votre graphique actuel. - Tendance à la hausse - ligne rouge au-dessus de la bleue (et les deux lignes sont au-dessus du nuage)
The   Fibonacci Confluence Toolkit   is a technical analysis tool designed to help traders identify potential price reversal zones by combining key market signals and patterns. It highlights areas of interest where significant price action or reactions are anticipated, automatically applies Fibonacci retracement levels to outline potential pullback zones, and detects engulfing candle patterns. Its unique strength lies in its reliance solely on price patterns, eliminating the need for user-define
The main idea of this indicator is rates analysis and prediction by Fourier transform. Indicator decomposes exchange rates into main harmonics and calculates their product in future. You may use the indicator as a standalone product, but for better prediction accuracy there is another related indicator - FreqoMaster - which uses FreqoMeterForecast as a backend engine and combines several instances of FreqoMeterForecast for different frequency bands. Parameters: iPeriod - number of bars in the ma
Trend Ray
Andriy Sydoruk
The indicator shows the potential trend direction by cyclical-wave dependence. Thus, all the rays of the intersection will be optimal rays, in the direction of which the price is expected to move, taking into account the indicator period. Rays can be used as a direction for potential market movement. But we must not forget that the approach must be comprehensive, the indicator signals require additional information to enter the market.
Line
Andrea Fontanini
free only until the end of the week The following indicator must be used and contextualized according to your trading methodologies. It provides excellent trading insights and identifies rejection zones on the drawn lines. Several parameters can be customized. The indicator will plot three levels above and below the opening price on D1, W1, and MN1. It will provide the daily ADR and display two additional daily sessions (EUROPE session and USA session). The colors of the various lines can be cu
FREE
Nouvelle version plus précise de l'indicateur Xmaster. Plus de 200 commerçants du monde entier ont effectué plus de 15 000 tests de différentes combinaisons de cet indicateur sur leurs PC afin d'obtenir la formule la plus efficace et la plus précise. Et ici, nous vous présentons l'indicateur « Indicateur de formule Xmaster forex sans repeindre », qui affiche des signaux précis et ne repeint pas. Cet indicateur envoie également des signaux au commerçant par e-mail et push. Avec l'arrivée de chaq
"Auto FIBO Pro" Crypto_Forex indicator - est un excellent outil auxiliaire dans le trading ! - L'indicateur calcule et place automatiquement sur le graphique les niveaux de Fibo et les lignes de tendance locales (couleur rouge). - Les niveaux de Fibonacci indiquent les zones clés où le prix peut s'inverser. - Les niveaux les plus importants sont 23,6 %, 38,2 %, 50 % et 61,8 %. - Vous pouvez l'utiliser pour le scalping inversé ou pour le trading en grille de zones. - Il existe également de nomb
PW Oscillator
Svyatoslav Kucher
5 (1)
PW Oscillator   - индикатор предназначенный для поиска локальных экстремумов, определения текущей тенденции. В расчетах индикатора используется авторская методика. С помощью индикатора можно определять места возможного разворота цены желательно в направлении тенденции, но также с достаточной точностью и против нее. Также с помощью индикатора можно определять текущую тенденцию. Индикатор подходит для любых валютных пар, но для адекватного отображения показания необходимо, чтобы было достаточно ис
LordChannel
Igor Pereira Calil
LordChannel is an indicator for META TRADER 4 for all forex pairs and financial market metals. The indicator is used to make detections of high/low channels, implementing a technical analysis on possible breakouts and making correct order entries. LordChannel sends signals such as buy and sell in the graphical analysis, it is important to emphasize that the importance of these signals are safe in TIME FRAMES M30, H1, H4. The indicator was created for using bullish/downtrend channels to compl
PZ Penta O MT4
PZ TRADING SLU
2.33 (3)
The Penta-O is a 6-point retracement harmonacci pattern which usually precedes big market movements. Penta-O patterns can expand and repaint quite a bit. To make things easier this indicator implements a twist: it waits for a donchian breakout in the right direction before signaling the trade. The end result is an otherwise repainting indicator with a very reliable trading signal. The donchian breakout period is entered as an input. [ Installation Guide | Update Guide | Troubleshooting | FAQ | A
FREE
Cet indicateur innovant de mesure de la force des devises de INFINITY est une aide indispensable pour les scalpers et les commerçants qui négocient à long terme. Le système d'analyse De la force/faiblesse des devises est connu depuis longtemps et utilisé sur le marché par les principaux traders du monde. Tout commerce d'arbitrage n'est pas complet sans cette analyse. Notre indicateur détermine facilement la force des devises sous-jacentes les unes par rapport aux autres. Il affiche des graphiqu
FREE
This indicator shows the gaps on the current chart with a rectangle shape and indicates when the gap is filled by closing the shape. Gaps are considered over the shadows. Allows sending alerts by e-mail or push notifications when a gap is found. Parameters SizeGAP - Size of the gap that you want to indicate; HGcolor1 - Color of the gap in an upward movement; HGcolor2 - Color of the gap in a downward movement; HGstyle - The style of rectangle to be drawn; StartCalculationFromBar - How many candl
A trend indicator based on the CCI indicator. ZI Trend PaintBar Indicator is an improved variant of the CCI indicator, which shows the moment of trend following quite accurately. Combination of CCI indicator makes a better use of these advantages: Colored candlesticks showing the trend direction based on CCI indicator. Messages/Sounds (Notifications and sound settings) Mail - enable/disable sending emails. Alerts - enable/disable messages in the terminal when signals occur. Push - enable/disable
Les acheteurs de ce produit ont également acheté
Gann Made Easy
Oleg Rodin
4.83 (162)
Gann Made Easy est un système de trading Forex professionnel et facile à utiliser qui est basé sur les meilleurs principes de trading en utilisant la théorie de mr. WD Gann. L'indicateur fournit des signaux d'ACHAT et de VENTE précis, y compris les niveaux Stop Loss et Take Profit. Vous pouvez échanger même en déplacement en utilisant les notifications PUSH. VEUILLEZ ME CONTACTER APRÈS L'ACHAT POUR RECEVOIR GRATUITEMENT DES INSTRUCTIONS DE TRADING ET D'EXCELLENTS INDICATEURS SUPPLÉMENTAIRES! Vou
M1 Sniper
Oleg Rodin
5 (22)
M1 SNIPER est un système d'indicateurs de trading facile à utiliser. Il s'agit d'un indicateur à flèche conçu pour l'unité de temps M1. Cet indicateur peut être utilisé seul pour le scalping sur l'unité de temps M1 ou intégré à votre système de trading existant. Bien que conçu spécifiquement pour le trading sur l'unité de temps M1, ce système peut également être utilisé avec d'autres unités de temps. Initialement, j'avais conçu cette méthode pour le trading du XAUUSD et du BTCUSD. Cependant, je
Le système PRO Renko est un système de trading très précis spécialement conçu pour le trading de graphiques RENKO. Il s'agit d'un système universel qui peut être appliqué à divers instruments de négociation. Le système neutralise efficacement ce qu'on appelle le bruit du marché en vous donnant accès à des signaux d'inversion précis. L'indicateur est très facile à utiliser et n'a qu'un seul paramètre responsable de la génération du signal. Vous pouvez facilement adapter l'outil à n'importe que
Advanced Supply Demand
Bernhard Schweigert
4.91 (299)
Offre spéciale : 40 % de réduction La solution idéale pour les traders débutants comme experts ! Cet indicateur est un outil de trading unique, performant et abordable grâce à l’intégration de nombreuses fonctionnalités exclusives et d’une nouvelle formule. Cette mise à jour vous permet d’afficher des zones sur deux unités de temps. Vous pourrez ainsi visualiser non seulement une unité de temps supérieure, mais aussi l’unité de temps du graphique, ainsi que l’unité de temps supérieure : des z
Market Makers
Mohamed Hassan
5 (3)
After purchase, contact me privately to receive 1 month of free testing with EA Forex Proton! This advanced MT4 trading robot automatically executes signals from any MT4 indicator, including Market Makers. The latest version also includes AI integration, allowing each trade signal to be analyzed using Artificial Intelligence. Live Signal with EA Forex Proton: Click here Market Makers is a powerful price action trading system designed to identify high-probability Buy and Sell opportunities based
Trend Screener
STE S.S.COMPANY
4.79 (95)
Indicateur de tendance, solution unique révolutionnaire pour le trading et le filtrage des tendances avec toutes les fonctionnalités de tendance importantes intégrées dans un seul outil ! Il s'agit d'un indicateur multi-période et multi-devises 100 % non repeint qui peut être utilisé sur tous les symboles/instruments : forex, matières premières, crypto-monnaies, indices et actions. OFFRE À DURÉE LIMITÉE : L'indicateur Support and Resistance Screener est disponible pour seulement 65 $ et à vie. (
Signal GoldRush Trend Arrow L'indicateur GoldRush Trend Arrow Signal fournit une analyse précise et en temps réel des tendances, spécialement conçue pour les scalpers à haute vitesse et à court terme sur la paire XAU/USD. Conçu spécialement pour les intervalles de temps d'une minute, cet outil affiche des flèches directionnelles indiquant clairement les points d'entrée, ce qui permet aux scalpers de naviguer en toute confiance dans des conditions de marché volatiles. L'indicateur se compose
NAM Divergences
NAM TECH GROUP, CORP.
5 (1)
MT4 Multi-timeframe Divergence and Overbougt/Oversold detection indicator. Features - Fully customizable on chart control panel, provides complete interaction. - Hide and show control panel wherever you want. - Real time information about non-capitalized divergences. - Real time information about overbougt / oversold situations. - Real time information about regular divergences. - Real time information about hidden divergences. - Oscillators available for divergences detection: AO, RSI, CCI, MA
Super Signal – Skyblade Edition Système de signaux de tendance professionnel sans repaint / sans latence, avec un taux de réussite exceptionnel | Pour MT4 / MT5 Il fonctionne mieux sur des unités de temps inférieures, comme 1 minute, 5 minutes et 15 minutes. Caractéristiques principales : Super Signal – Skyblade Edition est un système de signaux intelligent conçu spécifiquement pour le trading de tendance. Il utilise une logique de filtrage multicouche pour détecter uniquement les mouvements d
L'indicateur « Dynamic Scalper System » est conçu pour la méthode de scalping, permettant de trader au sein des vagues de tendance. Testé sur les principales paires de devises et l'or, il est compatible avec d'autres instruments de trading. Fournit des signaux pour l'ouverture de positions à court terme le long de la tendance, avec un support supplémentaire pour les fluctuations de prix. Principe de l'indicateur : De grandes flèches déterminent la direction de la tendance. Un algorithme de gén
Auto Optimized Parabolic RSI : Moteur de Momentum 3D Avancé La plupart des indicateurs pour les particuliers échouent car ils s'appuient sur des paramètres statiques qui se brisent dès que la volatilité du marché change. L'Auto Optimized Parabolic RSI résout le problème de l'« obsolescence des indicateurs » en recalculant continuellement son propre avantage mathématique, apportant une adaptation quantitative de niveau institutionnel directement sur votre terminal MT5. L'Avantage Principal : Opti
Scalper Inside PRO
Alexey Minkov
4.74 (69)
Scalper Inside PRO – Since 2020. An exclusive indicator that utilizes an innovative algorithm to swiftly and accurately determine the market trend. The indicator automatically calculates opening, closing, and profit levels, providing detailed trading statistics. With these features, you can choose the most appropriate trading instrument for the current market conditions. Additionally, you can easily integrate your own arrow indicators into Scalper Inside Pro to quickly evaluate their statistics
Apollo SR Master est un indicateur de support/résistance doté de fonctionnalités spéciales qui simplifient et fiabilisent le trading basé sur les zones de support/résistance. Cet indicateur calcule ces zones en temps réel, sans aucun décalage, en détectant les sommets et les creux locaux des prix. Pour confirmer la nouvelle zone de support/résistance, il affiche un signal spécifique indiquant que cette zone peut être prise en compte et utilisée comme un véritable signal d'achat ou de vente. Dans
ACTUELLEMENT 40% DE RÉDUCTION La meilleure solution pour tout débutant ou trader expert ! Cet indicateur est un outil de trading unique, de haute qualité et abordable car nous avons incorporé un certain nombre de caractéristiques exclusives et une nouvelle formule. Avec seulement UN graphique, vous pouvez lire la force de la devise pour 28 paires Forex ! Imaginez comment votre trading va s'améliorer parce que vous êtes capable de repérer le point de déclenchement exact d'une nouvelle tendance
Ultimate Sniper Dashboard
Hispraise Chinedum Abraham
4.82 (22)
Prix réduit à 299 $ ! Les prix peuvent augmenter à l'avenir ! Lisez la description ci-dessous ! Meilleur système d'entrée pour le tableau de bord Ultimate Sniper : NIVEAUX DYNAMIQUES ULTIMES. (Veuillez consulter mes produits) L'Ultimate Sniper Dashboard fonctionne UNIQUEMENT sur les marchés en direct en raison des limites des tests multidevises de MT4. Voici l'Ultimate-Sniper Dashboard ! Notre meilleur produit qui contient à la fois HA-Sniper, MA-Sniper et de nombreux modes spéciaux. L'Ultima
Currency Strength Wizard est un indicateur très puissant qui vous offre une solution tout-en-un pour un trading réussi. L'indicateur calcule la puissance de telle ou telle paire de devises en utilisant les données de toutes les devises sur plusieurs périodes. Ces données sont représentées sous la forme d'un indice de devise facile à utiliser et de lignes électriques de devise que vous pouvez utiliser pour voir la puissance de telle ou telle devise. Tout ce dont vous avez besoin est d'attacher l'
Atomic Analyst
Issam Kassas
5 (5)
Tout d'abord, il convient de souligner que cet indicateur de trading n'est ni repainting, ni redrawing et ne présente aucun délai, ce qui le rend idéal à la fois pour le trading manuel et automatisé. Manuel de l'utilisateur : réglages, entrées et stratégie. L'Analyste Atomique est un indicateur d'action sur les prix PA qui utilise la force et le momentum du prix pour trouver un meilleur avantage sur le marché. Équipé de filtres avancés qui aident à éliminer les bruits et les faux signaux, et à
BTMM State Engine Pro is a MetaTrader 4 indicator for traders who use the Beat The Market Maker approach: Asian session context, kill zone timing, level progression, peak formation detection, and a multi-pair scanner from a single chart. It combines cycle state logic with a built-in scanner dashboard so you do not need the same tool on many charts at once. What it does Draws the Asian session range; session times can follow broker server offset or be set in inputs. Tracks level progression (L
KT Alpha Hunter Arrows MT4
KEENBASE SOFTWARE SOLUTIONS
La plupart des indicateurs à flèches vous donnent un signal, puis vous laissent gérer tout le reste seul. KT Alpha Hunter Arrows vous fournit un plan de trading complet. Chaque flèche de signal s’affiche avec un plan déjà tracé : ligne d’entrée, stop loss, quatre niveaux de take profit et un verdict d’edge en temps réel indiquant si ce symbole et cette unité de temps méritent d’être tradés maintenant. Le package inclut un Trade Manager EA qui prend en charge l’exécution après votre entrée, afin
Dynamic Forex28 Navigator
Bernhard Schweigert
4.43 (7)
Dynamic Forex28 Navigator - L'outil de trading Forex de nouvelle génération. ACTUELLEMENT 49 % DE RÉDUCTION. Dynamic Forex28 Navigator est l'évolution de nos indicateurs populaires de longue date, combinant la puissance de trois en un : Advanced Currency Strength28 Indicator (695 avis) + Advanced Currency IMPULSE avec ALERT (520 avis) + CS28 Combo Signals (Bonus). Détails sur l'indicateur https://www.mql5.com/en/blogs/post/758844 Qu'offre l'indicateur de force de nouvelle génération ? Tout
ACTUELLEMENT 40% DE RÉDUCTION ! ! La meilleure solution pour tout débutant ou Expert Trader ! Cet indicateur est un outil de trading unique, de haute qualité et abordable car nous avons incorporé un certain nombre de caractéristiques exclusives et une formule secrète. Avec seulement UN graphique, il donne des alertes pour les 28 paires de devises. Imaginez comment votre trading s'améliorera parce que vous serez capable de repérer le point de déclenchement exact d'une nouvelle tendance ou d'un
FX Volume
Daniel Stein
4.63 (38)
FX Volume : Découvrez le Sentiment du Marché tel que perçu par un Courtier Présentation Rapide Vous souhaitez faire passer votre approche de trading au niveau supérieur ? FX Volume vous fournit, en temps réel, des informations sur la manière dont les traders particuliers et les courtiers sont positionnés—bien avant la publication de rapports retardés comme le COT. Que vous visiez des gains réguliers ou recherchiez simplement un avantage plus solide sur les marchés, FX Volume vous aide à repére
TPSpro RFI Levels
Roman Podpora
4.86 (28)
INSTRUCTIONS RUS  /  INSTRUCTIONS   ENG  /  Version MT5 Fonctions principales : Affiche les zones actives des vendeurs et des acheteurs ! L'indicateur affiche tous les niveaux/zones de première impulsion corrects pour les achats et les ventes. Lorsque ces niveaux/zones sont activés, là où commence la recherche de points d'entrée, ils changent de couleur et se remplissent de certaines couleurs. Des flèches apparaissent également pour une perception plus intuitive de la situation. LOGIC AI - Affi
Cycle Sniper
Elmira Memish
4.39 (36)
Please contact us after your purchase and we will send you the complimentary indicators to complete the system Cycle Sniper is not a holy grail but when you use it in a system which is explained in the videos, you will feel the difference. If you are not willing to focus on the charts designed with Cycle Sniper and other free tools we provide, we recommend not buying this indicator. We recommend watching the videos about the indiactor and system before purchasing. Videos, settings  and descri
Documentation for connecting Metatrader 4 with Python with a simple drag and drop EA.   A full end-to-end solution ,fully tested ,fast and efficient! The Pytrader ecosystem consists of a python script and a MT4 EA. (  MT5  version ) Further for the licensing an indicator is used.  The communication between the python script and the EA is based on sockets. EA is the  Server   and the python script the  Client .  It is always query(function / python script) and output(data / server). The EA doe
Route Lines Prices - est un indicateur conçu pour identifier les directions des prix. Son interface simple intègre plusieurs algorithmes de calcul du comportement des prix et de leur direction future. Ces algorithmes incluent le calcul de la volatilité et le lissage des prix en fonction des unités de temps utilisées. L'indicateur possède un unique paramètre permettant de modifier la valeur « Calculating price values ». La valeur par défaut de 1 assure un calcul automatique équilibré, utilisabl
Volatility Trend System - un système de trading qui donne des signaux pour les entrées. Le système de volatilité donne des signaux linéaires et ponctuels dans le sens de la tendance, ainsi que des signaux pour en sortir, sans redessiner ni retarder. L'indicateur de tendance surveille la direction de la tendance à moyen terme, montre la direction et son changement. L'indicateur de signal est basé sur les changements de volatilité et montre les entrées sur le marché. L'indicateur est équipé de pl
Trend indicator AI
Ramil Minniakhmetov
4.53 (83)
L'indicateur Trend Ai est un excellent outil qui améliorera l'analyse du marché d'un trader en combinant l'identification des tendances avec des points d'entrée exploitables et des alertes d'inversion. Cet indicateur permet aux utilisateurs de naviguer dans les complexités du marché forex avec confiance et précision Au-delà des signaux primaires, l'indicateur Trend Ai identifie les points d'entrée secondaires qui surviennent lors des retraits ou des retracements, permettant aux traders de capit
GOLD Impulse with Alert
Bernhard Schweigert
4.67 (12)
Cet indicateur est une super combinaison de nos 2 produits Advanced Currency IMPULSE with ALERT  +   Currency Strength Exotics . Il fonctionne pour tous les cadres temporels et montre graphiquement l'impulsion de force ou de faiblesse pour les 8 principales devises plus un symbole ! Cet indicateur est spécialisé pour montrer l'accélération de la force des devises pour tout symbole comme l'or, les paires exotiques, les matières premières, les indices ou les contrats à terme. C'est le premier
Trend Swing
Mohamed Hassan
4.5 (10)
Achetez Trend Swing et vous pourriez obtenir un autre indicateur appelé Analyse du Marché GRATUITEMENT en tant que BONUS ! Contactez-nous en privé pour obtenir vos instructions privées et votre BONUS ! PROMO : $49 pendant 48 heures pour célébrer la sortie officielle ! Le prix suivant est de $89. (se termine le jeudi 11 à 23h59 heure E.T) Trend Swing est un indicateur professionnel développé à partir de zéro par notre équipe interne. Cet indicateur est très sophistiqué car vous pouvez voir
Plus de l'auteur
This indicator Super Channel Pro Pluss indicator.Indicator displays trend movement. Indicator calculates automatically line. Features FiltPer - displays indicator channel period. deviation - displays indicator channel deviation. deviation2 - displays indicator channel deviation. deviation3 - displays indicator channel deviation. How to understand the status: If the arrow is up and line color Teal ;trend is up. If the arrow is down and line color Red; trend is down. If the arrow is Yellow close
This indicator displays the ZigZag Pointer Fibonacci Expansion Triangle movements timeframes only M1-W1. Parameters InDepth: Displays the Depth movements. InDeviation: Displays the Deviation movements. InBackstep: Displays the Backstep movements. Fibonacci Expansion: Displays the Fibonacci Expansion movements. Fibonacci Expansion true.(false) Triangle: Displays the Triangle movements. Triangle true.(false) How to understand the status: If the Triangle is green, trend is up. If the Triangle is r
This indicator displays the trend movements. Parameters Trend: Displays the trend movements, true/false. X: moves the trend left and right. Y: moves the trend up and down. How to understand the status: (M1), square indicates the timeframe for 1 minute. If the square is green, trend is up. If the square is red, trend is down. (M5), square indicates the timeframe for 5 minute. If the square is green, trend is up. If the square is red, trend is down. (M15), square indicates the timeframe for 15 mi
This indicator helps to define the dominant trend. The Blue line and Red line changes at incrementations of the trends. Parameters ki: factor of the delay. per: Displays the indicator period. Trend: Displays the Trend movements. Trend true.(false) X: moves the trend left and right. Y: moves the trend up and down. How to understand the status: If the arrow is blue, trend is up. If the arrow is red, trend is down.
This indicator displays the trend movements. Parameters XRMultiplier: XR multiplier. Line: line movement (true/false). XRzak: XRzak movements (true/false). Arrow1: arrow movements (true/false). Arrow2: arrow movements up and down (true/false). Trend: trend movements (true/false). X: move the trend left and right. Y: move the trend up and down. How to understand the status: If the arrow is green, trend is up. If the arrow is red, trend is down.
This indicator displays the trend movements. Parameters XRMultiplier1: XR multiplier 1. XRMultiplier2: XR multiplier 2. Line1: line 1 movement (true/false). Line2: line 2 movement (true/false). XRTrend: XR trend displays Line 1 and Line 2 movements (true/false). X: move the trend left and right. Y: move the trend up and down. How to understand the status: If the Line is green, trend is up. If the Line is red, trend is down.
This indicator zone indicator.Indicator displays high and low zone. Features Green color - Shows movement on the high zone. Red colr - Shows movement on the low zone. Yellow colr - Shows movement on the zero zone.    How to understand the status: If the bar is higher than the yellow color line , trend is up. If the bar is lower than the yellow color line , trend is down.
Super
Mati Maello
This indicator super indicator.Indicator displays trend movement. Indicator calculates automatically bars Features FiltPer - displays indicator period. Multiplier - displays indicator multiplier. How to understand the status: If the indicator bar is higher , trend is up. If the indicator bar is lower , trend is down. IIIIIIIIIIIIIIIIIIIIIIIIIIIIIIIIIIIIIIIIIIIIIIIIIIIIIIIIIIIIIIIIIIIIII
This indicator displays super power trend movement. Features Multiplier - displays multiplier movement. Multiplier2 - displays multiplier2 movement. Trend - displays indicator trend 1 and trend 2 (true/false). separate_windor - displays trend separate window.(0-1....) X - move the trend left and right. Y - move the trend up and down. How to understand the status: If the Trend color is green, trend is up. If the Trend color is red, trend is down.
This indicator displays Super Power  Beeta trend movement.Indicator is version 2 . Features Multiplier - displays multiplier movement. Multiplier2 - displays multiplier2 movement. Trend - displays indicator trend 1 and trend 2 (true/false). Background:color - displays background color (true/false). separate_window - displays trend separate window.(0-1....) separate_window2 - displays trend (background color )separate window.(1-2....) X - move the trend left and right. Y - move the trend up an
This indicator Master XR indicator.Indicator displays trend movement. Indicator calculates automatically line. Features FiltPer - displays indicator period. deviation - displays indicator deviation. deviation2 - displays indicator deviation. How to understand the status: If (Timeframe M1-H1) FiltPer = 100; If ( Timeframe H4-MN) FiltPer = 5-20; ////////////////////////////////////////////////////////////////////////////////////////////////////////////////////////////////////////////////////// //
This indicator Super MA Pluss indicator.Indicator displays trend movement. Indicator calculates automatically line. Features FiltPer - displays indicator period. How to understand the status: If the arrow is green, trend is up. If the arrow is red, trend is down. /////////////////////////////////////////////////////////////////////////////////////////////////////////////////////////////////////////////////// ///////////////////////////////////////////////////////////////////////////////////////
This indicator Super Channel Arrow and zak indicator.Indicator displays trend movement. Indicator calculates automatically line. Features FiltPer - displays indicator channel period. FiltPer2 - displays indicator period. deviation - displays indicator channel deviation. How to understand the status: If the arrow is green, trend is up. If the arrow is red, trend is down. best FiltPer ,period timeframe M1-H1 (100);H4-MN (50) best FiltPer2, period timeframe M1-H1 (50);H4-MN (25) //////////////////
This indicator Super Channel Pro indicator.Indicator displays trend movement. Indicator calculates automatically line. Features FiltPer - displays indicator channel period. deviation - displays indicator channel deviation. deviation2 - displays indicator channel deviation. How to understand the status: If the arrow is green, trend is up. If the arrow is red, trend is down. ///////////////////////////////////////////////////////////////////////////////////////////////////////////////////////////
This indicator Super XT indicator.Indicator displays trend movement. Indicator calculates automatically line. Features FiltPer - displays indicator period. Window - displays indicator trend (true/false). Trend - displays indicator trend (true/false). X - move the trend left and right. Y - move the trend up and down.     How to understand the status: If the Trend color is green, trend is up. If the Trend color is red, trend is down. ////////////////////////////////////////////////////////
This indicator Super Turbo indicator.Indicator displays trend movement. Indicator calculates automatically line. Features FiltPer - displays indicator period. Step - displays indicator Step. Trend - displays indicator trend (true/false). X - move the trend left and right. Y - move the trend up and down. How to understand the status: If the Trend color is green, trend is up. If the Trend color is red, trend is down. ///////////////////////////////////////////////////////////////////////////
Pluuto Alert
Mati Maello
1 (1)
This indicator Pluuto Alert indicator.Indicator displays trend movement. Indicator calculates automatically line.Alert = arrow.When the alert is up the next alert is down,when the alert is down the next alert is up (new bar). Features FiltPer - displays indicator period.Line1. FiltPer2 - displays indicator period.Line2. Multiplier - displays indicator multiplier.(FlitPer,Line1;step) Deviation1 - displays indicator deviation.(Line2) Deviation2 - displays indicator deviation.(Arrow) Trend - displa
This indicator Pluuto Alert Plus indicator.Indicator displays trend movement. Indicator calculates automatically line.Alert = FiltPer.When the alert is up the next alert is down,when the alert is down the next alert is up (new bar). Features FiltPer - displays indicator period.Line1. FiltPer2 - displays indicator period.Line2. Multiplier - displays indicator multiplier.(FlitPer,Line1;step) Deviation1 - displays indicator deviation.(Line2) Deviation2 - displays indicator deviation.(Line2) Deviati
This indicator Pluuto Alert Pro indicator.Indicator displays trend movement. Indicator calculates automatically line.Alert = (FiltPer1,Line1_Arrow).When the alert is up the next alert is down,when the alert is down the next alert is up (new bar). Features FiltPer1 - displays indicator period.Per1 FiltPer2 - displays indicator period.Per2. FiltPer3 - displays indicator period.Per3. Multiplier1_per1 - displays indicator multiplier.(FlitPe1,step) Multiplier2_line1 - displays indicator multiplier.(L
This indicator XX Power indicator.Indicator displays trend movement. Indicator helps to buy and sell.In dicator displays arrow and line. Features FiltPer - displays indicator period. How to understand the status:   If the Trend color is green, trend is up. I f the Trend color is red, trend is down.    //////////////////////////////////////////////////////////////////////////////////////////////////////////////////////////////////////////////////// ////////////////////////////////////////////
This indicator Matrix X indicator.Indicator displays Stochastic oscillator,Williams Percent Range,DeMarker,Relative Strength Index,Matrix trend movement. Indicator helps to buy and sell.Matrix trend = (Stochastic+WPR+DeMarker+RSI)/4. Features KPeriod - displays Stochastic K period. DPeriod - displays Stochastic D period. Slowing- displays Stochastic Slowing. Stochastic_Method - displays Stochastic Method. Stochastic_price - displays Stochastic Price. WPR_per - displays WPR period. Dem_per - disp
This indicator Mega Super indicator.Indicator displays trend movement. Indicator helps to buy and sell.In dicator displays arrow and line. Features per - displays indicator period. How to understand the status: If the arrow color is green, trend is up. I f the arrow color is red, trend is down. //////////////////////////////////////////////////////////////////////////////////////////////////////////////////////////////////////////////////// ///////////////////////////////////////////////////
Matic
Mati Maello
This indicator Matic indicator.Indicator displays trend movement. Indicator helps to buy and sell. The indicator shows the movement of sak1 and sak2 Stddevchannel, Regression. Features HLper - displays indicator iHighest and iLowest period. ExtDepth - displays indicator ExtDepth. ExtDeviation - displays indicator ExtDeviation. ExtBackstep - displays indicator ExtBackstep. zak1_ST_RE - displays indicator zak1,Stddevchannel,Regression.(true,false) zak2_ST_RE - displays indicator zak2,Stddevchannel
This indicator Matic Pro indicator.Indicator displays trend movement. Indicator helps to buy and sell. The indicator shows the movement of sak1 and sak2 Stddevchannel, Regression + zak2 indicator. Features HLper - displays indicator iHighest and iLowest period. ExtDepth - displays indicator ExtDepth. ExtDeviation - displays indicator ExtDeviation. ExtBackstep - displays indicator ExtBackstep. p - line indicator bars back.(bars back= zak2) m - regression.(1-8),the best(2-3) i0 -line indicator bar
This indicator Super Neuro Trend indicator.Indicator displays trend movement. Indicator helps to buy and sell. Features FiltPer- displays indicator period. deviation - displaus indicator deviation. Trend - displaus indicator trend.( true,false) Rectangle - displaus indicator rectangle. (true,false)  How to understand the status: If the trend color is green, trend is up. I f the trend color is red, trend is down. I f the trend waiting,trend waiting.     ///////////////////////////////////////////
This indicator Mega Super Neuro Trend indicator.Indicator displays trend movement. Indicator helps to buy and sell.Trend1= line1 > < line1,trend2=line1 > < line2,trend3 = line1,line2  > < line3. Features Trend - displaus indicator trend.( true,false) How to understand the status: If the trend color is green, trend is up. I f the trend color is red, trend is down. ///////////////////////////////////////////////////////////////////////////////////////////////////////////////////////////////////
This indicator XRX Master indicator.Indicator displays trend movement. Indicator helps to buy and sell. Features FiltPer- displays indicator period. deviation - displaus indicator deviation. deviation2 - displaus indicator deviation 2. HL_period - displaus indicator Highest and Lowest period. HL_period2 - displaus indicator Highest 2 and Lowest 2 period. How to understand the status: If the trend color arrow is green, trend is up. I f the trend color arrow is red, trend is down. ///////////
This indicator XXX Master indicator.Indicator displays trend movement. Indicator helps to buy and sell. Features per- displays indicator period. Step- displays indicator step. line- true (false) How to understand the status: If the trend color arrow is green, trend is up. I f the trend color arrow is red, trend is down. //////////////////////////////////////////////////////////////////////////////////////////////////////////////////////////////////////////////////// /////////////////////////////
Filtrer:
laptoplifestyle
2749
laptoplifestyle 2022.12.06 21:39 
 

Author is unresponsive, indicator is defective as shown as in the comment section and you cannot personalize the settings based on personal preferences. Still have a dark box overlapping the screen, not a good product.

Répondre à l'avis