Flat Global MT5
- Indikatoren
- Version: 1.21
- Aktualisiert: 13 April 2020
- Aktivierungen: 8

Beschreibung
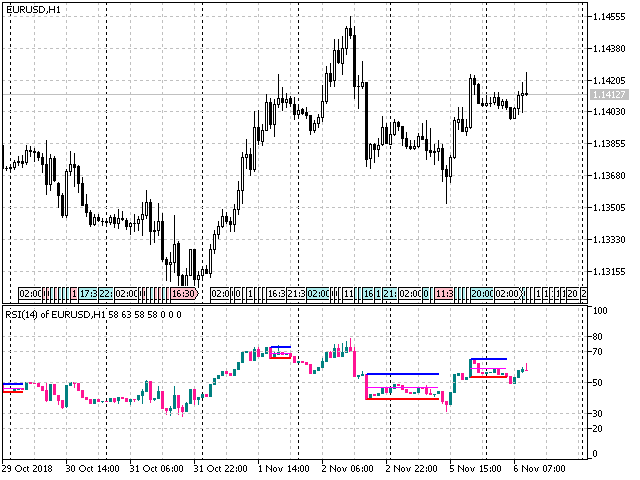
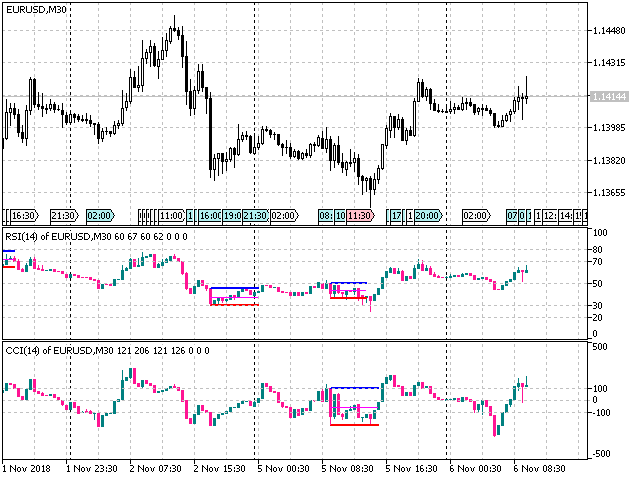
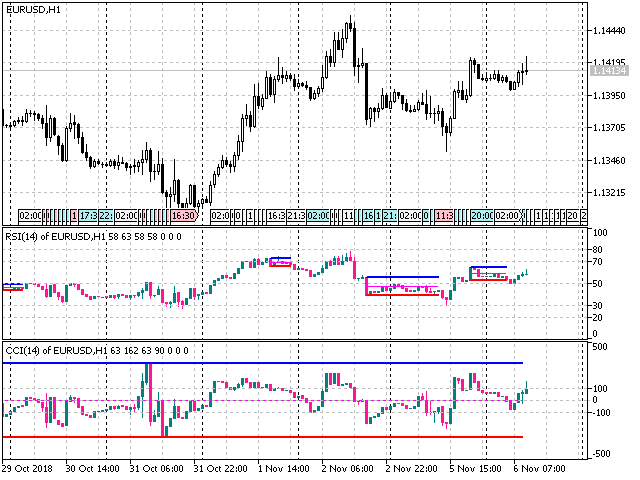
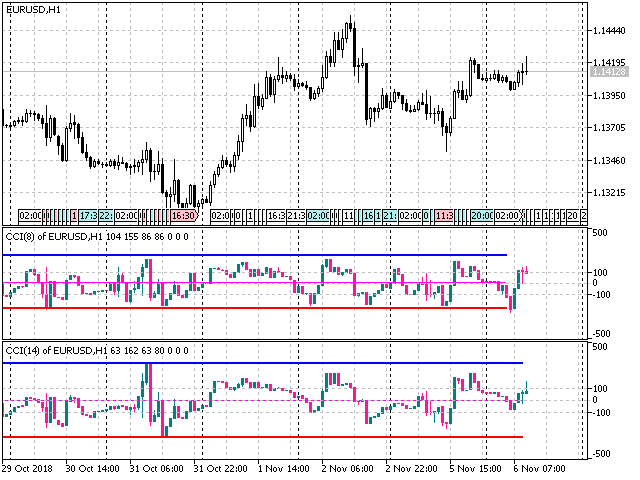
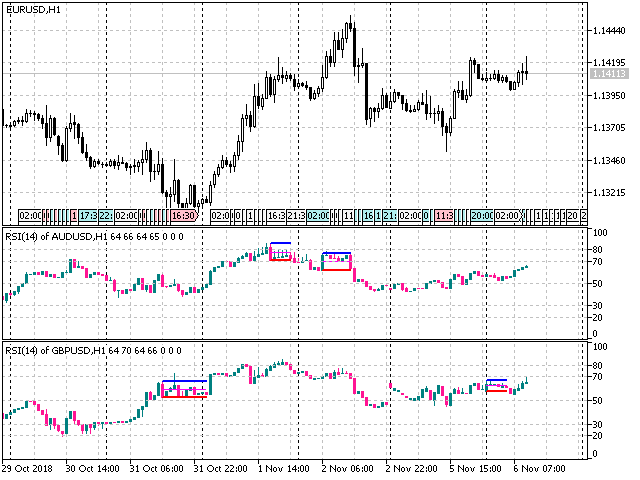
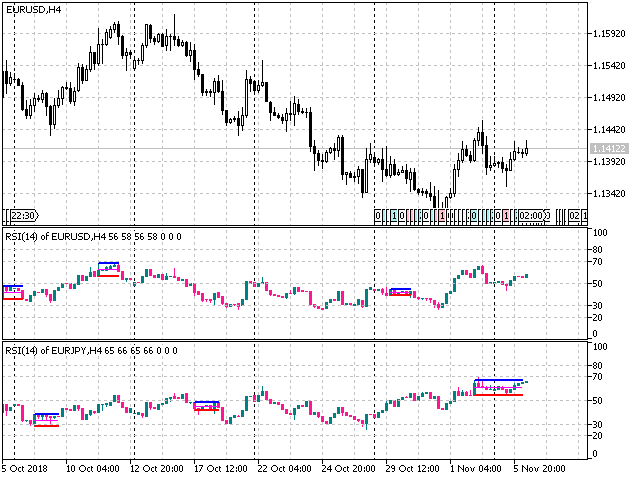
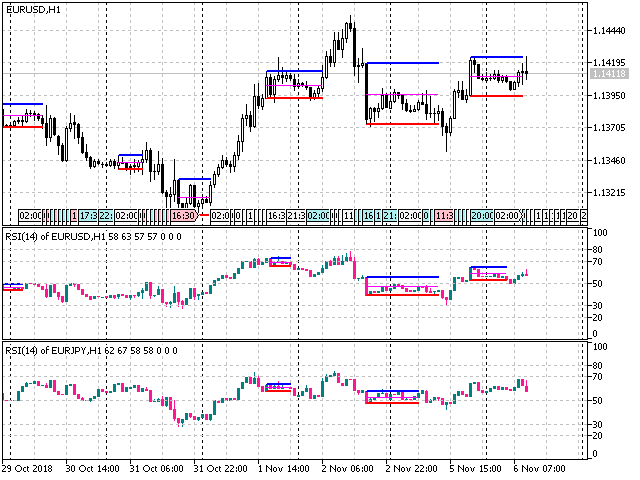
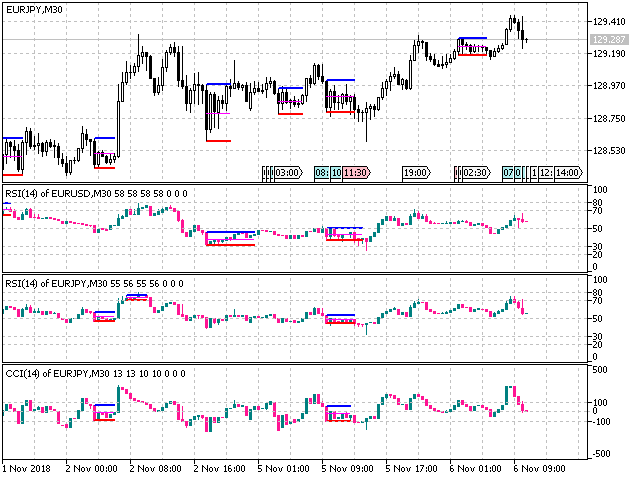
Der Indikator der lokalen Wohnung für CCI und RSI Indikatoren. Der Benutzer kann Finanzinstrumente auswählen.
Der Indikator ermöglicht es, lokale Flats in den folgenden Optionen zu finden:
- Breite der Kanäle, die nicht mehr als ein bestimmter Bereich ist
- Breite der Kanäle, die nicht kleiner als ein bestimmter Bereich ist
- Breite der Kanäle, die nicht mehr und nicht weniger als ein bestimmter Bereich ist
Der Indikator zeigt die Mitte und die Grenzen des Kanals an.
Zweck
Der Indikator kann für den manuellen oder automatisierten Handel innerhalb eines Expert Advisors verwendet werden. Die Werte des Indikatorpuffers vom Typ Double können für den automatisierten Handel verwendet werden:
- Die Werte des Indikators basieren auf den Eröffnungskursen - Puffer 0.
- Die Indikatorwerte, die auf High-Preisen basieren - Puffer 1.
- Die Indikatorwerte, die auf den Low-Preisen basieren - Puffer 2.
- Die Indikatorwerte auf der Grundlage der Schlusskurse - Puffer 3.
- Obere Begrenzungslinie - Puffer 5.
- Untere Begrenzungslinie - Puffer 6.
- Mittlere Linie des Kanals - Puffer 7.
Die Werte der Puffer dürfen nicht gleich EMPTY_VALUE sein.
Eingabeparameter
- Currency_Name - der Name des Finanzinstruments.
- Indicator_Number - die Nummer des Indikators.
- Bars_Number - die Anzahl der Bars, die in einem separaten Fenster angezeigt werden sollen.
- Perioden - Berechnungszeitraum des Indikators.
- MA_Methode - Mittelwertbildungsmethode für den MA des Basisindikators.
- Shift - die Verschiebung des Basis- und Berechnungsindikators relativ zum Preisdiagramm.
- Bulls_Color - die Farbe der bullischen Kerze.
- Bären_Farbe - die Farbe der bärischen Kerze.
- Range Wide - breiter Bereich.
- Range Tight - enger Bereich.
- Startlänge - Startlänge des Flats in Balken (Bereich zwischen 3 und 5).
- Print Messages - Erlaubnis für die Protokollierung von Meldungen.