Flat Global MT5
- Indicadores
- Versión: 1.21
- Actualizado: 13 abril 2020
- Activaciones: 8

Descripción
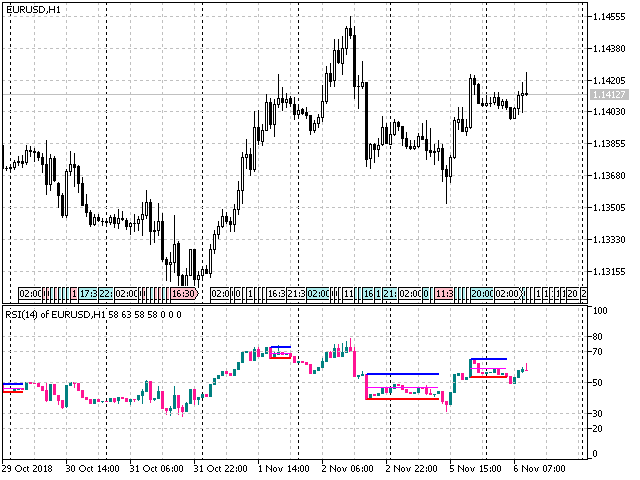
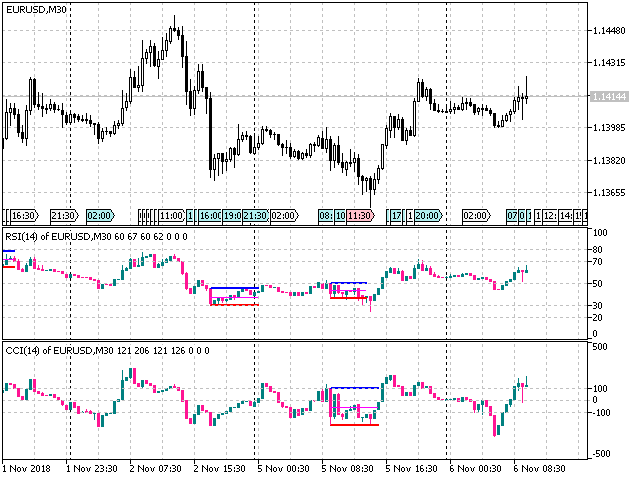
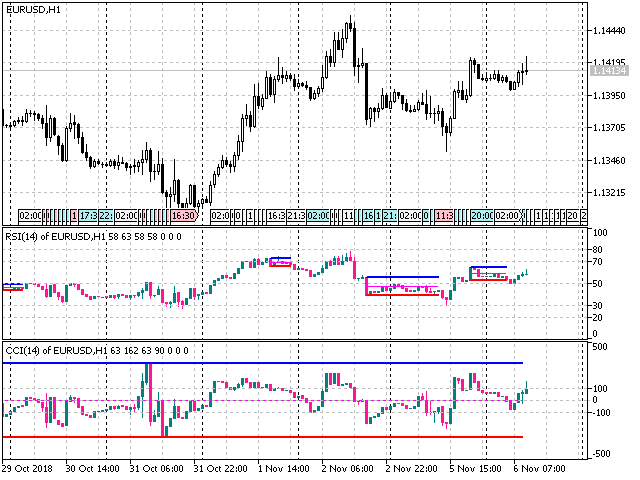
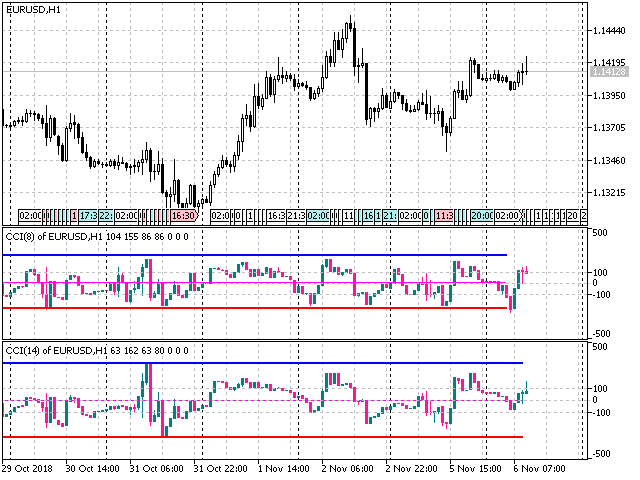
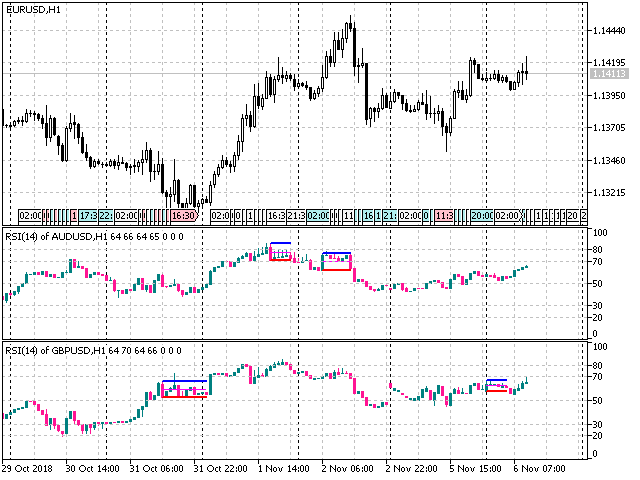
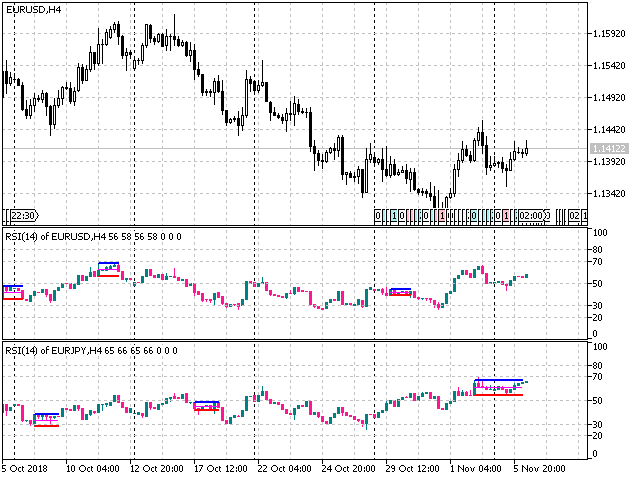
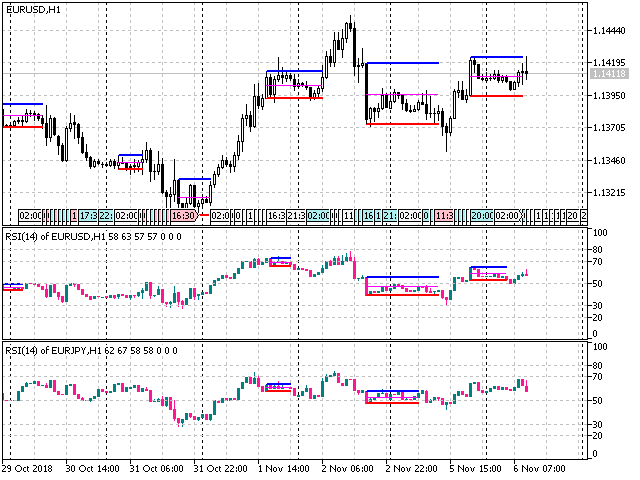
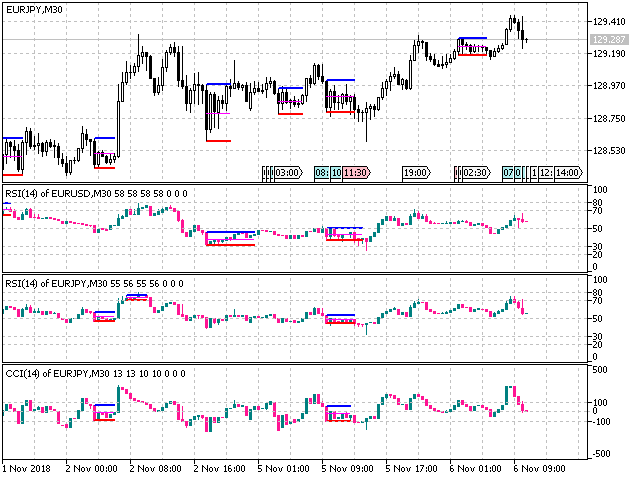
El indicador de plano local para los indicadores CCI y RSI. Los usuarios pueden seleccionar instrumentos financieros.
El indicador permite encontrar planos locales en las siguientes opciones:
- Ancho de los canales que no es más que cierto rango
- Ancho de los canales que no es inferior a cierto rango
- Anchura de los canales que no es superior ni inferior a un determinado rango
El indicador muestra el centro y los límites del canal.
Propósito
El indicador se puede utilizar para el comercio manual o automatizado dentro de un Asesor Experto. Los valores de la memoria intermedia del indicador de tipo doble se pueden utilizar para el comercio automatizado:
- Los valores del indicador basados en precios de Apertura - buffer 0.
- Los valores del indicador basados en precios Altos - buffer 1.
- Los valores del indicador basados en precios Bajos - buffer 2.
- Los valores del indicador basados en precios de Cierre - buffer 3.
- Línea límite superior - buffer 5.
- Línea límite inferior - buffer 6.
- Línea media del canal - buffer 7.
Los valores de los búferes no deben ser iguales a EMPTY_VALUE.
Parámetros de entrada
- Currency_Name - nombre del instrumento financiero.
- Indicator_Number - el número del indicador.
- Bars_Number - número de barras que se mostrarán en una ventana separada.
- Periods - periodo de cálculo del indicador.
- MA_Method - método de promediación para el MA del indicador básico.
- Shift - el desplazamiento del indicador básico y de cálculo relativo al gráfico de precios.
- Bulls_Color - el color de la vela alcista.
- Bears_Color - el color de la vela bajista.
- Range Wide - rango amplio.
- Range Tight - rango estrecho.
- Starting Length - longitud inicial del flat en barras (rango entre 3 y 5).
- Print Messages - permiso para registrar mensajes.