Levels ATR
- Indikatoren
- Version: 1.0
- Aktivierungen: 5

Der ATR Levels Indicator For MT4 ist ein Indikator, der speziell für Trader entwickelt wurde, die den Meta Trader 4 für ihre Handelsanalysen, die Erstellung von Charts verschiedener Währungspaare und Handelsaktiva, die technische Analyse und das Treffen von Handelsentscheidungen während des gesamten Handelstages nutzen.
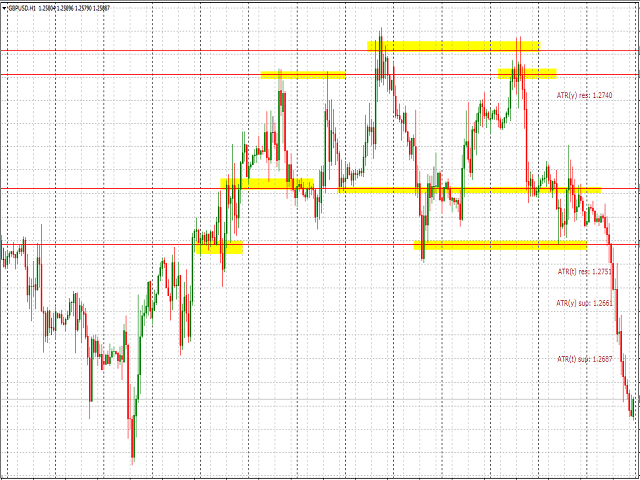
Einer der ersten großen Vorteile des ATR Levels Indicator For MT4 ist, dass er dem Trader automatisch hilft, sehr wichtige Niveaus auf den Märkten zu erkennen, die auf dem Average True Range Indicator basieren.
Dies bedeutet, dass der Händler, der den Indikator verwendet, sehr leicht in der Lage ist, die wichtigsten Kursniveaus zu identifizieren, bei denen der Markt das größte Potenzial hat, sich während des Handelstages umzukehren. Diese Niveaus werden für den Händler auf der Grundlage der Spanne, die der Kurs an diesen Stellen bildet, eingezeichnet.
Das bedeutet, dass der Kurs auf diesen Niveaus sehr leicht seine Richtung ändern kann.
Diese Niveaus werden als Unterstützungs- und Widerstandsniveaus bezeichnet. Unterstützungsniveaus sind die Preisbereiche unterhalb des Preises, in denen der Markt eine Art Hindernis für den Durchbruch des Preises unter dieses Niveau geschaffen hat.