Moving Above Average
- Indikatoren
- Version: 1.8
- Aktualisiert: 23 Mai 2020
- Aktivierungen: 5

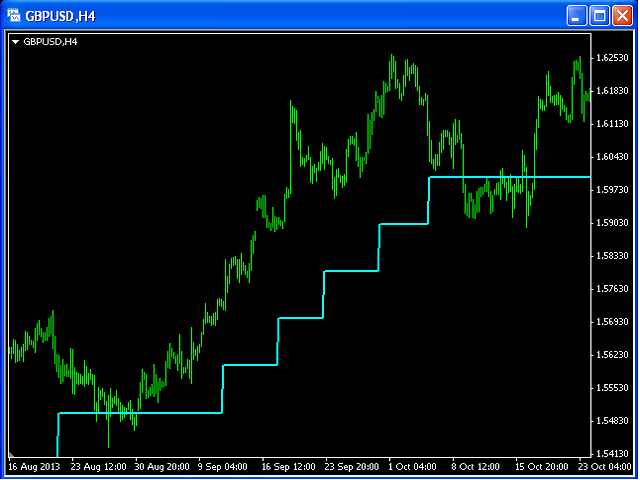
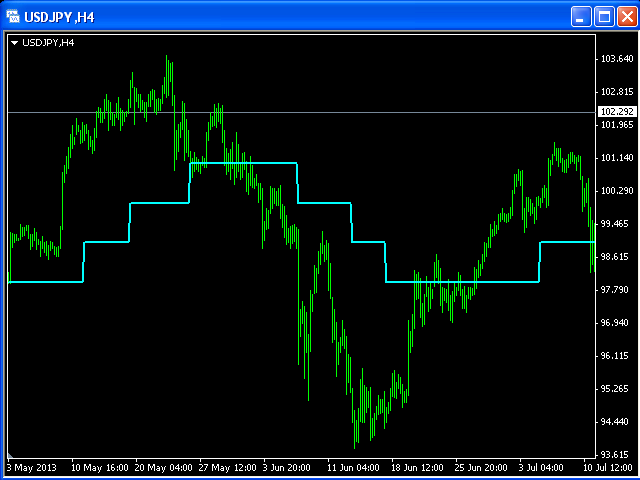
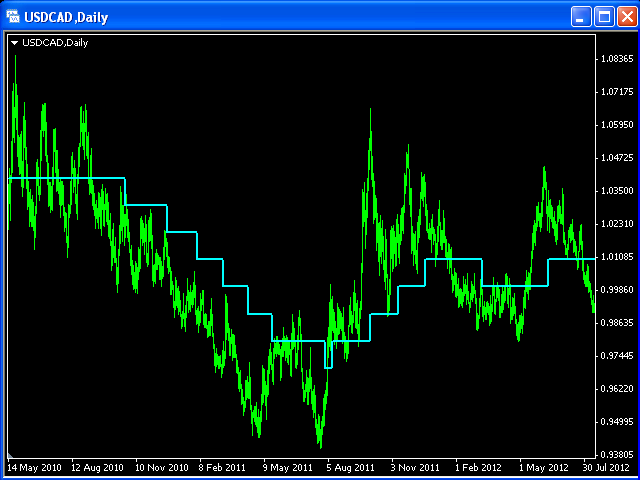
Ein gleitender Durchschnitt wird üblicherweise bei Zeitreihendaten verwendet, um kurzfristige Schwankungen zu glätten und längerfristige Trends zu ermitteln. Der vorgeschlagene Indikator hat die Fähigkeit, einen Glättungseffekt zu verstärken.
Dieser Indikator könnte eine wichtige Rolle bei der Bestimmung von Unterstützung und Widerstand spielen.
Ein Eingabeparameter nPeriod bestimmt die Anzahl der Bars für die Berechnung des gleitenden Durchschnitts.