Fibonacci Waves
- Indikatoren
- Version: 4.9
- Aktualisiert: 23 Mai 2020
- Aktivierungen: 5

Das Fibonacci-Verhältnis ist nützlich, um das Ziel der Bewegung einer Welle innerhalb einer Elliott-Wellen-Struktur zu messen. Verschiedene Wellen in einer Elliott-Wellen-Struktur stehen mit dem Fibonacci-Verhältnis in Beziehung zueinander. Zum Beispiel bei einer Impulswelle: - Welle 2 entspricht in der Regel 50 %, 61,8 %, 76,4 % oder 85,4 % von Welle 1.
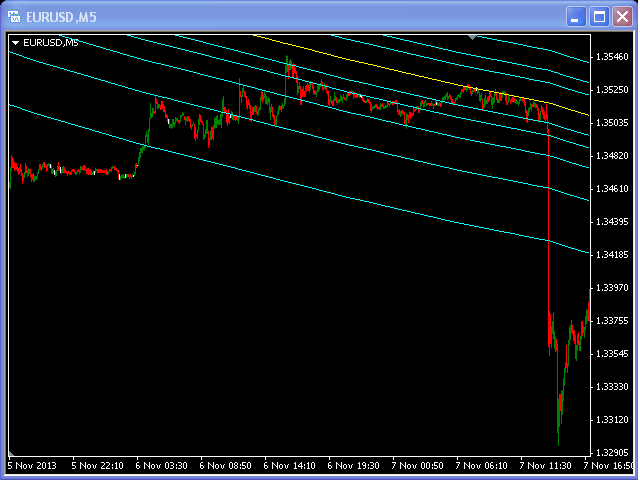
Fibonacci-Wellen können von Händlern verwendet werden, um Bereiche zu bestimmen, in denen sie im nächsten Abschnitt eines Auf- oder Abwärtstrends Gewinne mitnehmen möchten.