Gekko Strong Bars
- Indikatoren
- Version: 1.12
- Aktualisiert: 17 Februar 2023
- Aktivierungen: 5

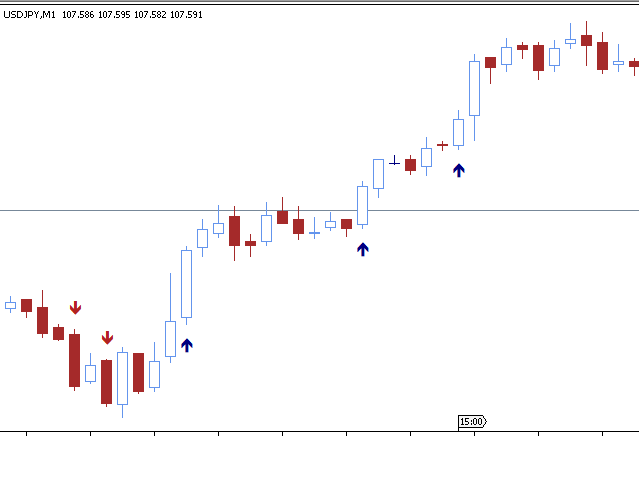
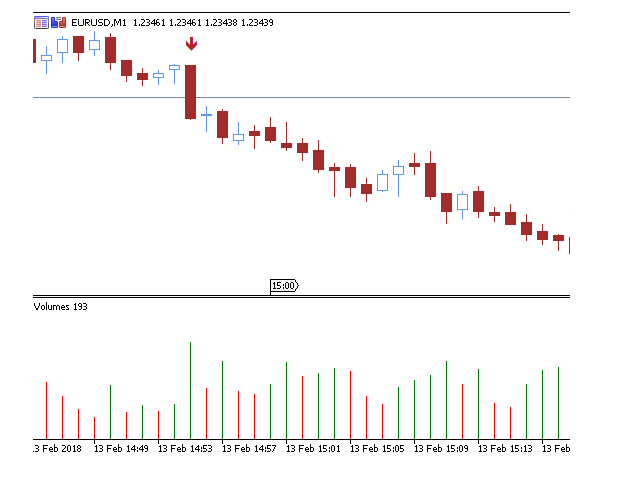
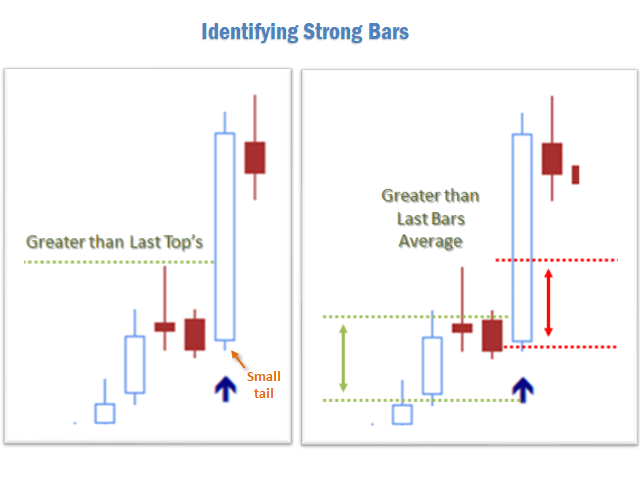
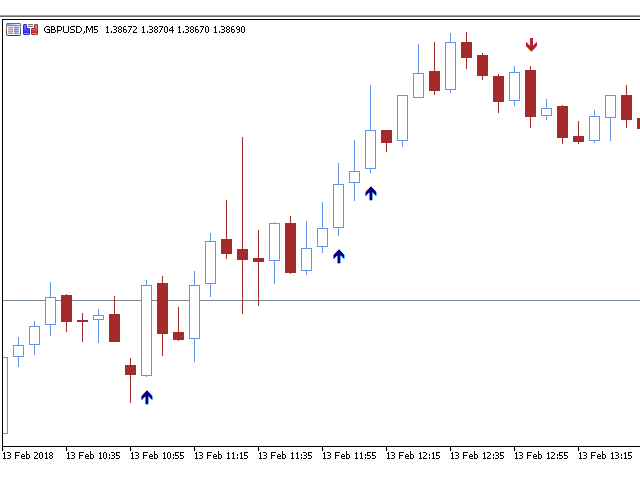
Dies ist der Strong Bars Indikator von Gekko. Er erzeugt Signale, wenn es einen starken Bullen- oder Bären-Balken gibt, dafür verwendet er drei verschiedene Bedingungen: 1 - wenn der aktuelle Balken höher/tiefer ist als die letzten x Balken (x ist ein Eingabeparameter), 2 - wenn die aktuelle Balkengröße höher ist als die durchschnittliche Größe der letzten x Balken (x ist ein Eingabeparameter) und 3 - wenn der aktuelle Balken einen kurzen Kerzenschwanz (Schatten) hat.
Eingaben
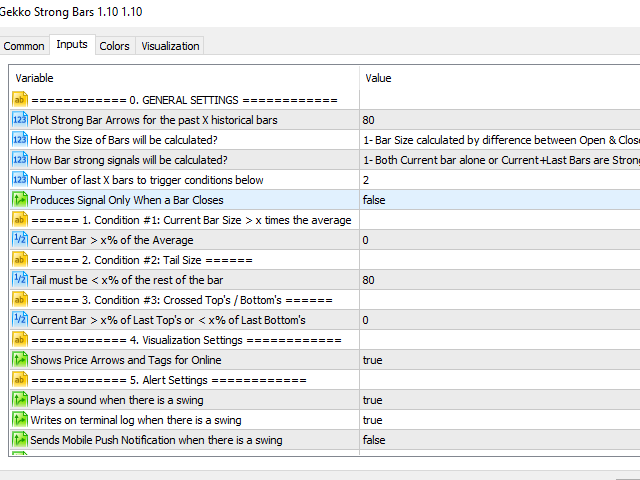
- Plot Strong Bar Arrows for the past X Historical Bars: Anzahl der historischen Balken, um den Indikator zu plotten, für eine bessere Performance niedrig halten;
- Wie die Größe der Balken berechnet wird:
- 1 - Die Balkengröße wird aus der Differenz zwischen Open und Close berechnet;
- 2 - Die Balkengröße wird anhand der Differenz zwischen High und Low berechnet;
- Wie werden starke Bar-Signale berechnet?
- 1 - sowohl der aktuelle Bar als auch der aktuelle und der letzte Bar sind stark;
- 2 - nur aktueller Balken ist stark;
- 3 - nur aktueller + letzter Balken sind stark;
- Anzahl der letzten X Takte, die die nachfolgenden Bedingungen auslösen: Anzahl der Takte, die für die Berechnung der nachfolgenden Bedingungen 1, 2 und 3 berücksichtigt werden;
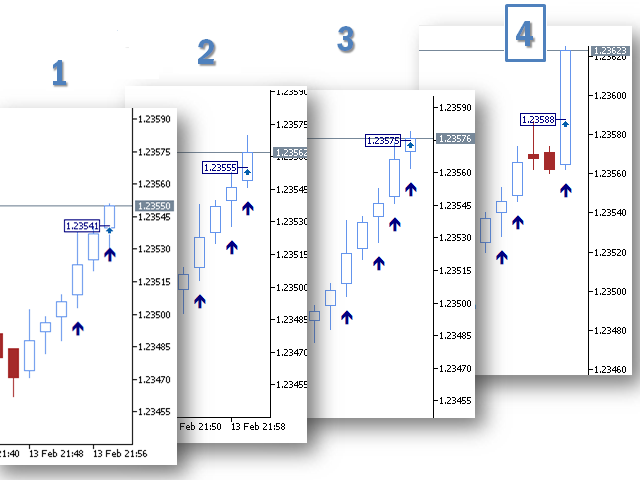
- Erzeugt ein Signal nur, wenn ein Balken schließt: Warten Sie, bis ein Balken schließt, um ein Signal zu erzeugen (genauer, durch verzögerten Einstieg) oder erzeugen Sie ein Signal online (könnte falsche Signale auslösen);
- Bedingung #1: Aktuelle Balkengröße > x% des Durchschnitts: eine der Bedingungen für einen starken Balken ist, dass seine Körpergröße größer als x% des Durchschnitts des letzten Balkens ist, konfigurieren Sie hier diesen %. Geben Sie 0 an, um mit dem Durchschnitt zu vergleichen, keine Abweichungen.
- Bedingung #2: Schwanzgröße: eine weitere Bedingung für einen starken Balken ist, dass seine Kerze einen sehr kurzen Schwanz hat, der der Kerze Kraft verleiht. Legen Sie hier fest, wie groß der Schwanz in % im Vergleich zum gesamten Kerzenkörper sein muss, damit er als starker Balken gilt. Geben Sie 100% ein, um die Größe des Schwanzes zu ignorieren.
- Bedingung #3: Gekreuzte Tops / Bottoms: ein starker Balken ist größer (wenn bullish) oder niedriger (wenn bearish) als die letzten Balken, es bedeutet, dass er stark ist, um die vorherigen Preisbereiche zu durchbrechen. Um falsche Signale zu vermeiden, geben Sie hier den Prozentsatz des letzten Hochs oder des letzten Tiefs an, um einen starken Balken zu bestätigen. Informieren Sie 0, um die letzten Hochs und Tiefs ohne Marge zu berücksichtigen.
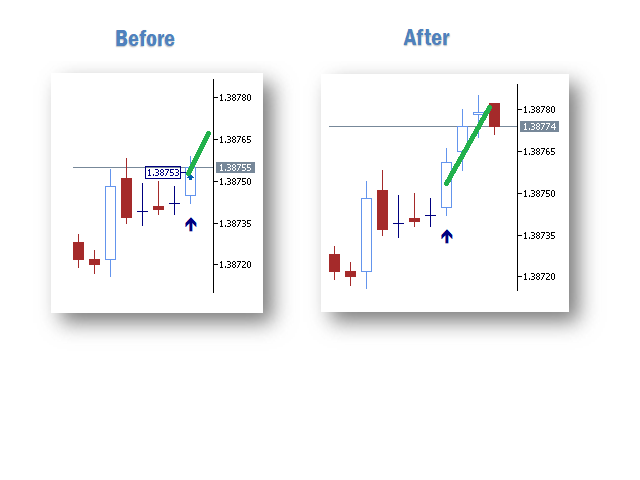
- Zeigt Preispfeile und Markierungen für Online: Wählen Sie diese Option, wenn Sie möchten, dass der Indikator Ihnen den Preis genau an der Stelle anzeigt, an der das Signal erzeugt wurde (funktioniert besser, wenn der Parameter Warten auf Balkenschluss falsch ist).
- Plays a sound when there is a swing: setzen Sie diese Option auf true und es wird jedes Mal ein Ton auf dem MetaTrader-Terminal abgespielt, wenn ein neues Signal erzeugt wird, das den Einstiegs- oder Ausstiegspunkt anzeigt.
- Write Logs On Terminal Window: Setzen Sie diese Option auf true, wenn Sie möchten, dass der Indikator jedes Mal, wenn ein neues Signal erzeugt wird, das Einstiegs- oder Ausstiegspunkte anzeigt, Protokolle auf der Registerkarte Experts des Terminals schreibt.
- Mobile Push-Benachrichtigungen senden: setzen Sie diese Option auf true, wenn Sie Push-Benachrichtigungen über die MetaTrader-App auf Ihrem Mobiltelefon erhalten möchten, wenn ein neues Signal erzeugt wird, das Einstiegs- oder Ausstiegspunkte anzeigt
- E-Mail-Benachrichtigungen senden: Setzen Sie diese Option auf true, wenn Sie E-Mail-Benachrichtigungen an die auf dem Terminal konfigurierte E-Mail-Adresse erhalten möchten, wenn ein neues Signal erzeugt wird, das Einstiegs- oder Ausstiegspunkte anzeigt.
Gute Trades!
Spenden Sie einen Teil Ihres Gewinns für gute Zwecke und humanitäre Einrichtungen Ihrer Wahl. "Geld gibt es nur, wenn es einen Zweck gibt, mit dem man es verdient".