Gekko Heiken Ashi Plus
- Indikatoren
- Version: 1.12
- Aktualisiert: 17 Februar 2023
- Aktivierungen: 5

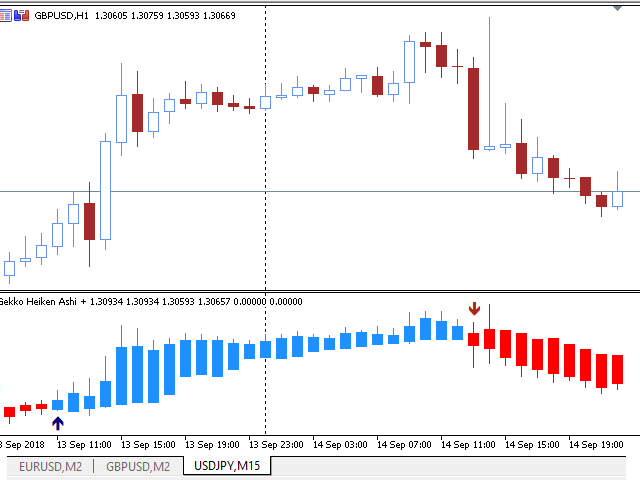
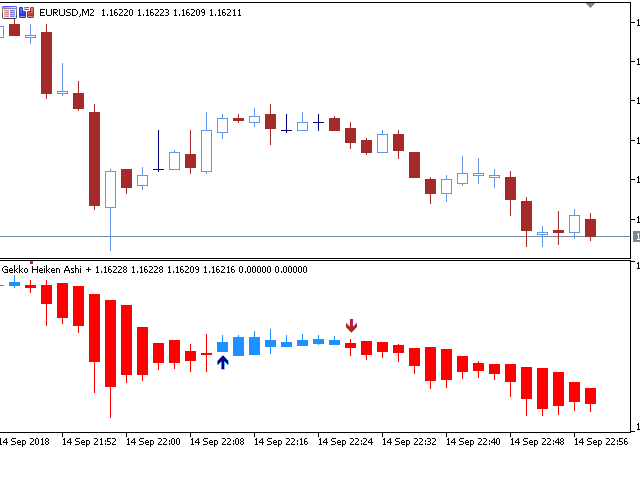
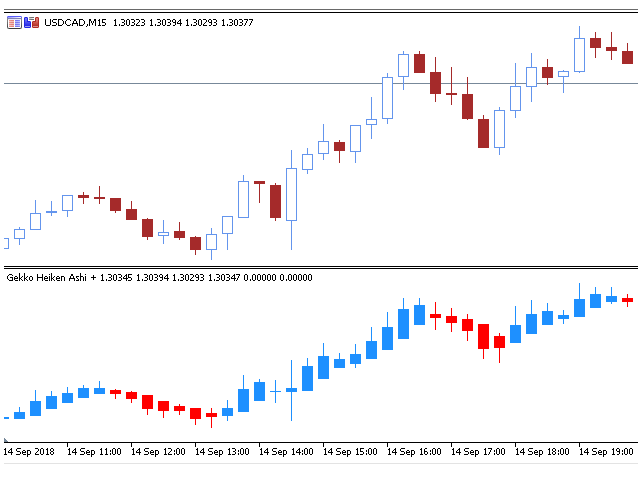
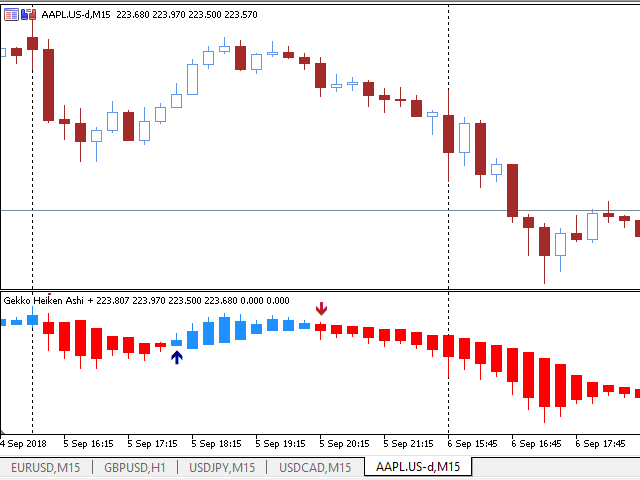
Dies ist die anpassbare Version des berühmten Heiken Ashi-Indikators von Gekko. Er erweitert die Anwendung des berühmten Heiken Ashi und berechnet starke Einstiegs- und Ausstiegssignale.
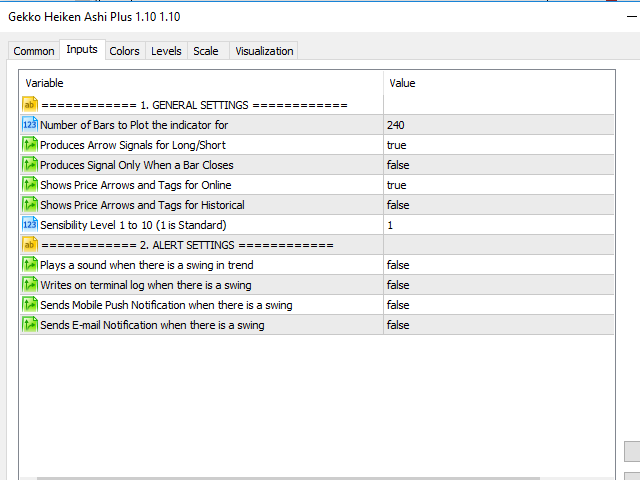
Eingaben
- Anzahl der Balken für den Indikator: Anzahl der historischen Balken für den Indikator, halten Sie sie niedrig für eine bessere Leistung;
- Produce Arrow Signals: Bestimmen Sie, ob der Indikator ein Pfeilsignal für Long/Short erzeugen soll;
- Erzeugt Signal nur, wenn ein Balken schließt: Warten Sie, bis ein Balken geschlossen ist, um ein Signal zu erzeugen (genauer, durch verzögerten Einstieg) oder erzeugen Sie das Signal online (könnte falsche Signale auslösen);
- Show Price Tags: ob der Indikator Preis-Tags anzeigt, wenn es ein Einstiegssignal gibt;
- Empfindlichkeit: Konfigurieren Sie verschiedene Empfindlichkeitsstufen, um den Indikator zu glätten und bessere Einstiegs-/Ausstiegssignale zu erhalten.
- Plays a sound when there is a swing: setzen Sie diese Option auf true und es wird jedes Mal ein Ton auf dem MetaTrader-Terminal abgespielt, wenn ein neues Signal erzeugt wird, das den Einstiegs- oder Ausstiegspunkt anzeigt.
- Write Logs On Terminal Window: setzen Sie diese Option auf true, wenn Sie möchten, dass der Indikator jedes Mal, wenn ein neues Signal erzeugt wird, das Einstiegs- oder Ausstiegspunkte anzeigt, Protokolle auf der Registerkarte Experts des Terminals schreibt.
- Mobile Push-Benachrichtigungen senden: setzen Sie diese Option auf true, wenn Sie Push-Benachrichtigungen über die MetaTrader-App auf Ihrem Mobiltelefon erhalten möchten, wenn ein neues Signal erzeugt wird, das Einstiegs- oder Ausstiegspunkte anzeigt
- E-Mail-Benachrichtigungen senden: Setzen Sie diese Option auf true, wenn Sie E-Mail-Benachrichtigungen an die auf dem Terminal konfigurierte E-Mail-Adresse erhalten möchten, wenn ein neues Signal erzeugt wird, das Einstiegs- oder Ausstiegspunkte anzeigt.
Gute Trades!
Spenden Sie einen Teil Ihres Gewinns für gute Zwecke und humanitäre Einrichtungen Ihrer Wahl. "Geld gibt es nur, wenn es einen Zweck gibt, mit dem man es verdient".