Gekko Strong Bars
- Indicatori
- Versione: 1.12
- Aggiornato: 17 febbraio 2023
- Attivazioni: 5

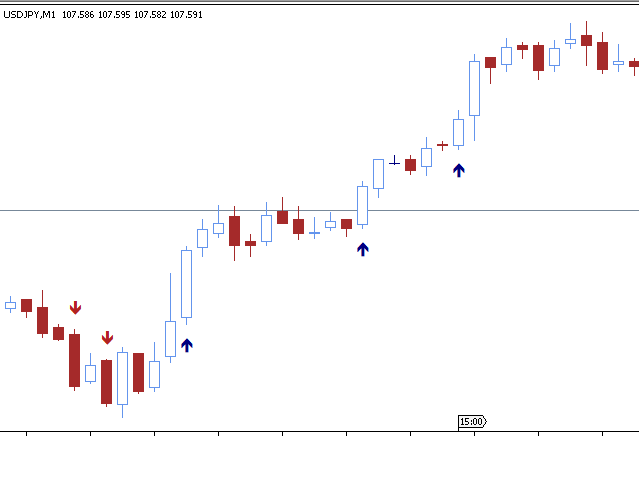
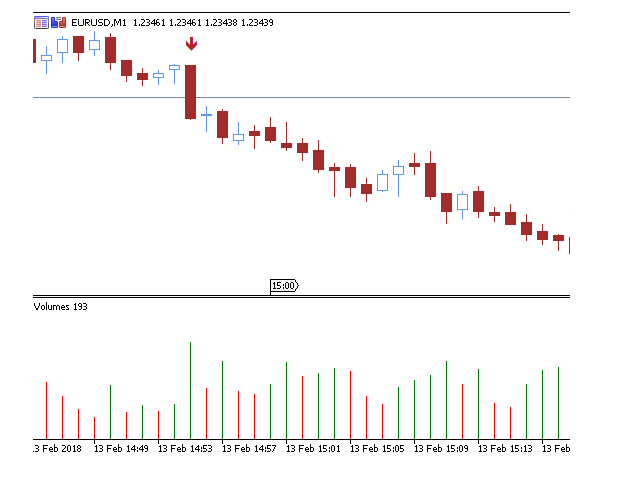
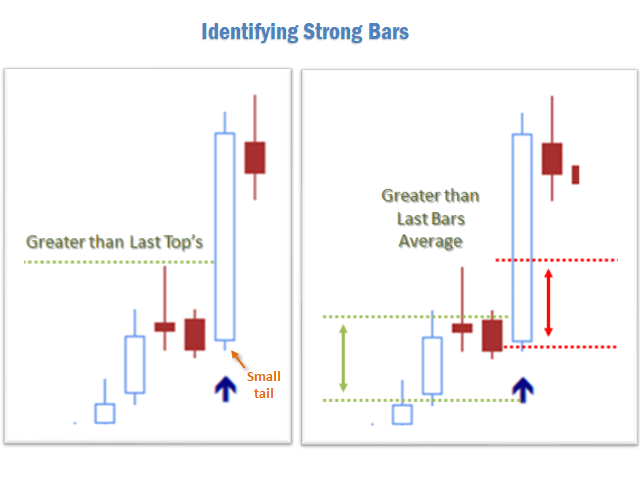
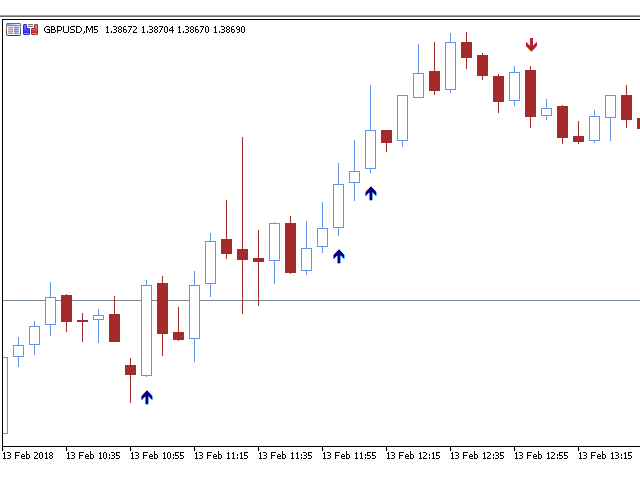
This is Gekko's Strong Bars indicator. It produces signals when there is a strong bullish or bearish bar, for that it uses three different conditions: 1 - when the current bar is higher/lower than the last x bars (x is an input parameter), 2 - when the current bar size is higher than the average size of the last x bars (x is an input parameter) and 3 - when the current bar has a short candle tail (shadow).
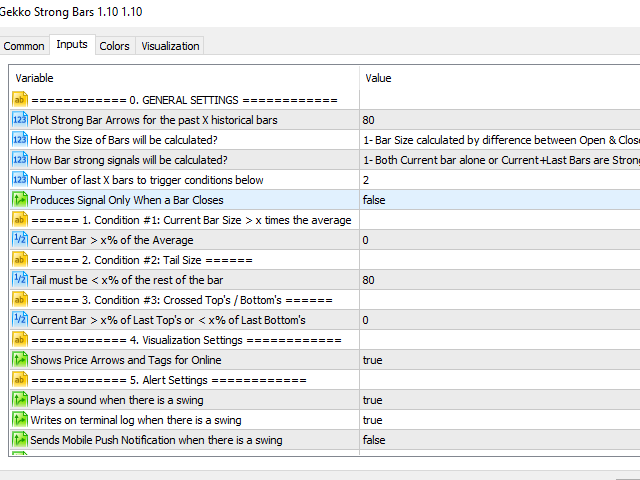
Inputs
- Plot Strong Bar Arrows for the past X Historical Bars: number of historical bars to plot the indicator, keep it low for better performance;
- How the Size of Bars will be calculated:
- 1 - bar size calculated by difference between Open and Close;
- 2 - bar size calculated by difference between High and Low;
- How Bar strong signals will be calculated?:
- 1 - both current bar alone or current+last bars are strong;
- 2 - only current bar is strong;
- 3 - only currrent + last bars are strong;
- Number of last X bars to trigger conditions below: number of bars to be considered for the calculation of the Conditions 1, 2 and 3 below;
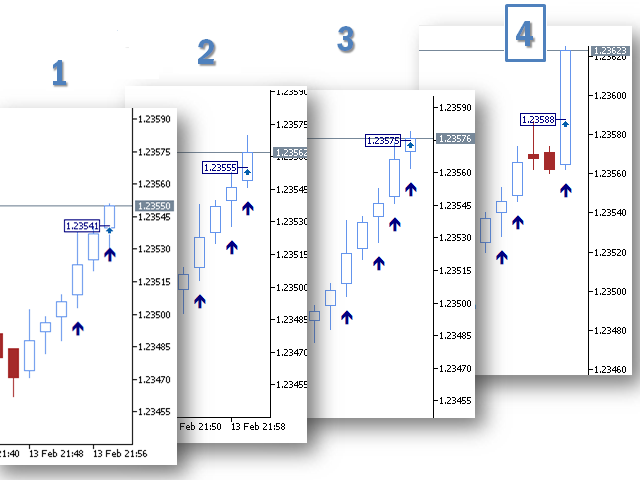
- Produces Signal Only When a Bar Closes: wait for a bar to close to produce a signal (more accurate, by delayed entry) or produces signal online (could trigger false signals);
- Condition #1: Current Bar Size > x% of the average: one of the conditions for a strong bar is to have its body size greater than x% of the last bars average, configure here this %. Inform 0 to compare against the average, no variations.
- Condition #2: Tail Size: another condition for a strong bar is that its candle has a very short tail that gives power to the candle. Configure here how big in % the tail has to be in comparison to the enire candle body to be considered a strong bar. Inform 100% to ignore tail's size.
- Condition #3: Crossed Top's / Bottom's: a strong bar is greater (if bullish) or lower (if bearish) than the last bars, it means it is strong to break through previous prices areas. To avoid fake signals, inform here the % of the last High or last Low for confirmation of a stong bar. Inform 0 to consider last High's and last Low's without any margin.
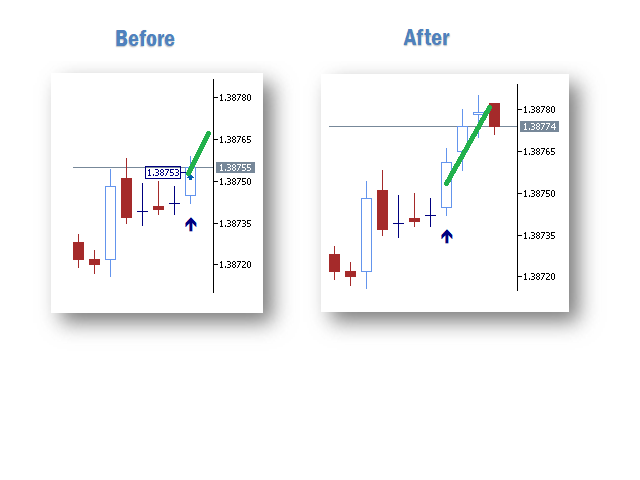
- Shows Price Arrows and Tags for Online: make it true if you want the indicator to show you the price exactly where the signal has been produced (works better when parameter waiting for bar close is false).
- Plays a sound when there is a swing: set it as true and it will play a sound on the MetaTrader terminal every time there is a new signal produced indicating entry or exit points.
- Write Logs On Terminal Window: set it as true if you want the indicator to write logs on the terminal's Experts tab every time a new signal is produced indicating entry or exit points
- Send Mobile Push Notifications: set it as true if you desire to receive push notifications on the MetaTrader app on your mobile when a new signal is produced indicating entry or exit points
- Send E-Mail Alerts: set it as true if you desire to receive e-mail alerts at the e-mail address configured on the terminal when a new signal is produced indicating entry or exit points
Good trades!
Donate part of your profit to good causes and humanitarian entities of your choice. "Money only comes if there's a purpose for you to earn it".