Gekko Channels Plus
- Indikatoren
- Version: 1.12
- Aktualisiert: 17 Februar 2023
- Aktivierungen: 5

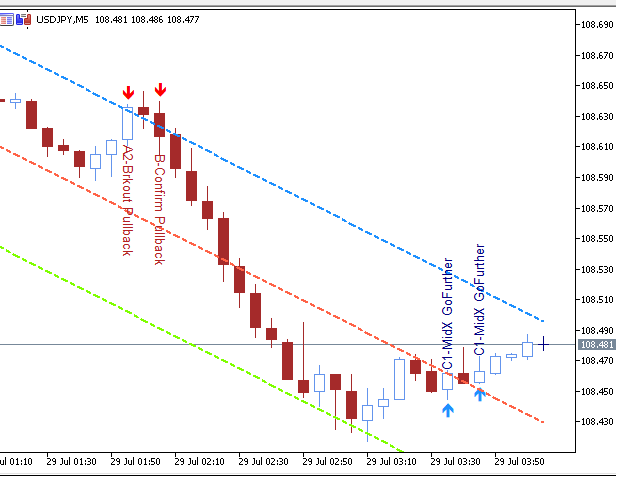
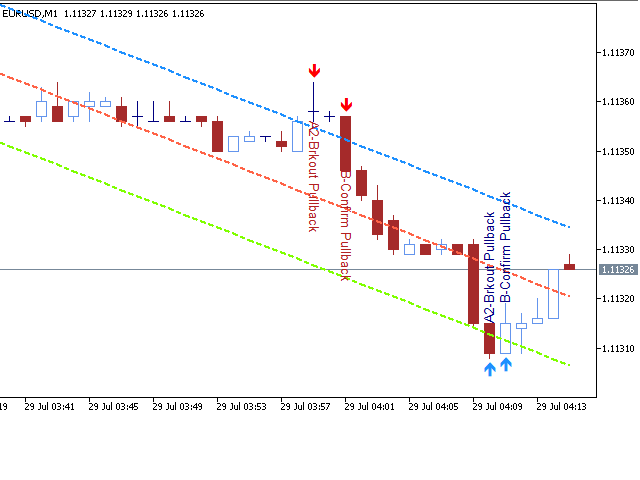
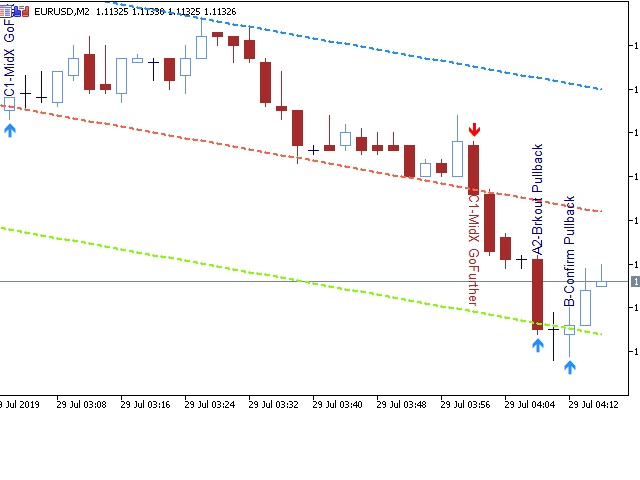
Dies ist der Channels Plus Indikator von Gekko. Er erweitert die Verwendung der berühmten Channels und berechnet starke Einstiegs- und Ausstiegssignale anhand der Preisbewegung an der oberen, unteren und mittleren Linie. Sie können ihn auf viele verschiedene Arten einrichten, z.B.: Pullback, Pullback gegen den Trend, Kreuzung der Mittellinie und Kreuzung der Mittellinie gegen den Trend.
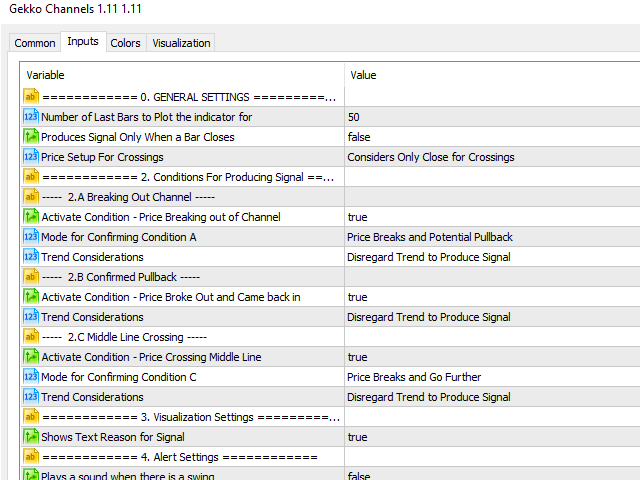
Eingaben
- Anzahl der Balken für die Darstellung des Indikators: Anzahl der historischen Balken für die Darstellung des Indikators, halten Sie diese für eine bessere Leistung niedrig;
- Erzeugt ein Signal nur, wenn ein Balken schließt: Warten Sie, bis ein Balken geschlossen ist, um ein Signal zu erzeugen (genauer, durch verzögerten Einstieg) oder erzeugen Sie ein Signal online (könnte falsche Signale auslösen);
- Bedingungen: Wählen Sie zwischen der Erzeugung von Signalen bei einem Pullback von der oberen oder unteren Linie, bei einem mittleren Linienpreis-Crossing oder beidem!
- Visualisierung: Einstellungen für die Anzeige von Texten auf den Balken, um die Signalbeschreibung anzuzeigen.
- Spielt einen Ton, wenn es einen Swing gibt: setzen Sie diese Einstellung auf true und es wird ein Ton auf dem MetaTrader-Terminal jedes Mal abgespielt, wenn ein neues Signal erzeugt wird, das Einstiegs- oder Ausstiegspunkte anzeigt.
- Write Logs On Terminal Window: setzen Sie diese Option auf true, wenn Sie möchten, dass der Indikator jedes Mal, wenn ein neues Signal erzeugt wird, das Einstiegs- oder Ausstiegspunkte anzeigt, Protokolle auf der Registerkarte Experts des Terminals schreibt.
- Mobile Push-Benachrichtigungen senden: setzen Sie diese Option auf true, wenn Sie Push-Benachrichtigungen über die MetaTrader-App auf Ihrem Mobiltelefon erhalten möchten, wenn ein neues Signal erzeugt wird, das Einstiegs- oder Ausstiegspunkte anzeigt
- E-Mail-Benachrichtigungen senden: Setzen Sie diese Option auf true, wenn Sie E-Mail-Benachrichtigungen an die auf dem Terminal konfigurierte E-Mail-Adresse erhalten möchten, wenn ein neues Signal erzeugt wird, das Einstiegs- oder Ausstiegspunkte anzeigt.
Gute Trades!
Spenden Sie einen Teil Ihres Gewinns für gute Zwecke und humanitäre Einrichtungen Ihrer Wahl. "Geld gibt es nur, wenn es einen Zweck gibt, mit dem man es verdient".

Looks like a very powerful tool, thanks for this.