KT Supply and Demand MT5
- Indikatoren
-
KEENBASE SOFTWARE SOLUTIONS
 Keenbase Trading entwickelt professionelle MetaTrader 4- und MetaTrader 5-Indikatoren sowie Expert Advisors, die Trader dabei unterstützen, fundiertere Handelsentscheidungen zu treffen.
 - Version: 1.0
- Aktivierungen: 10
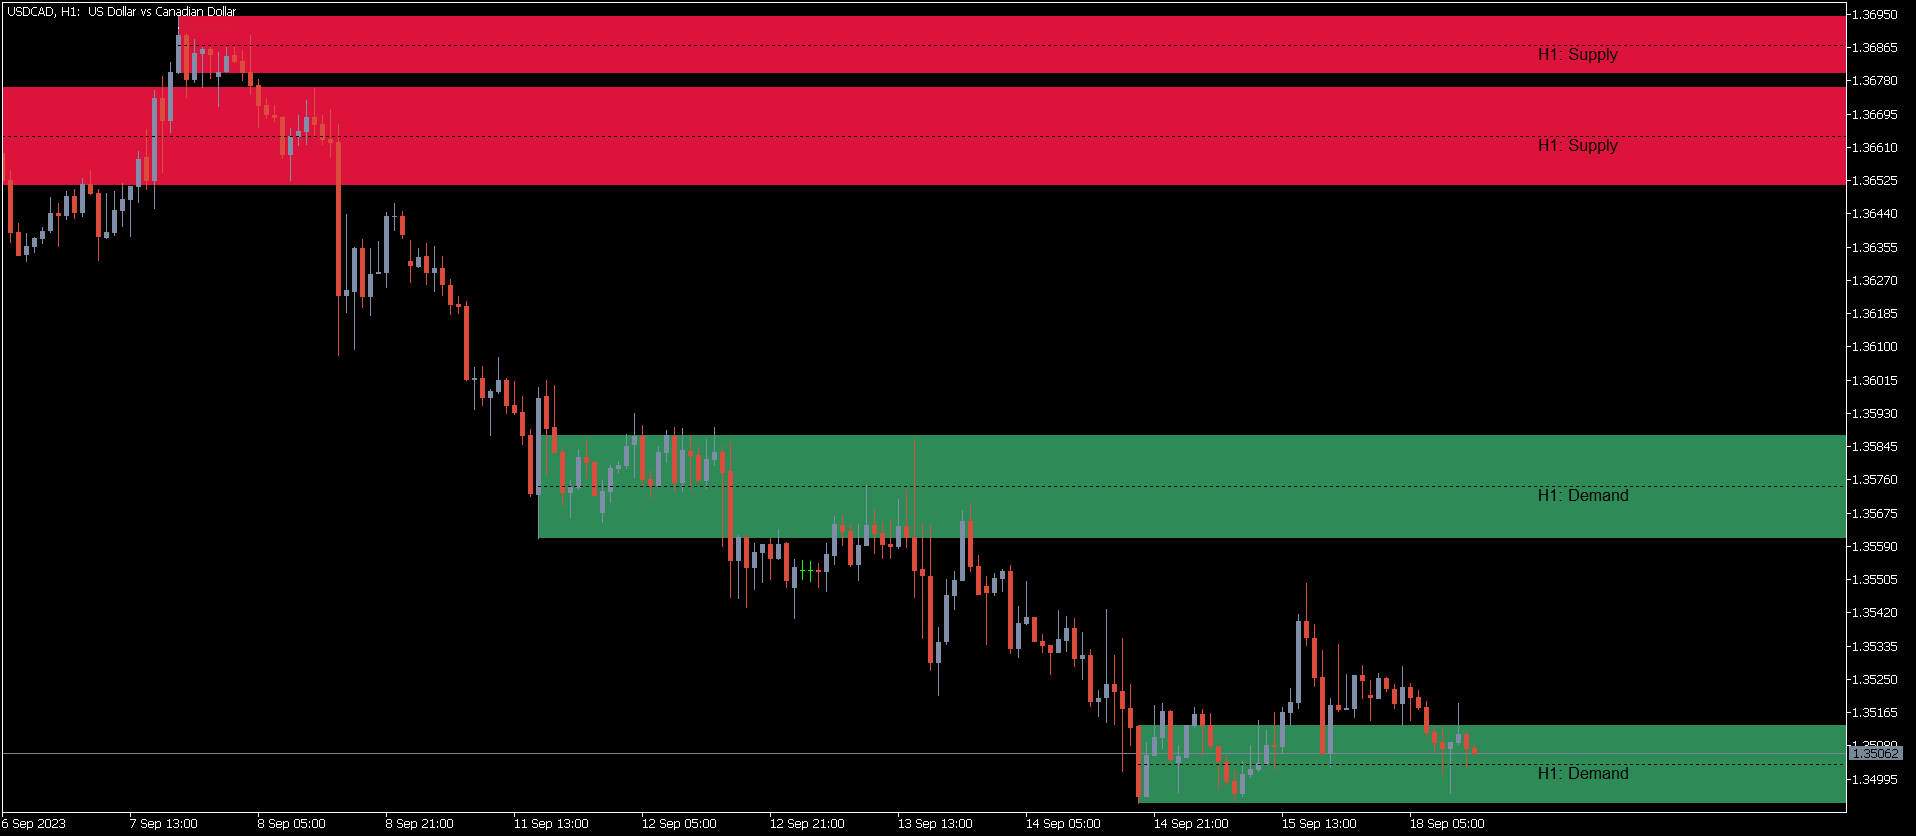
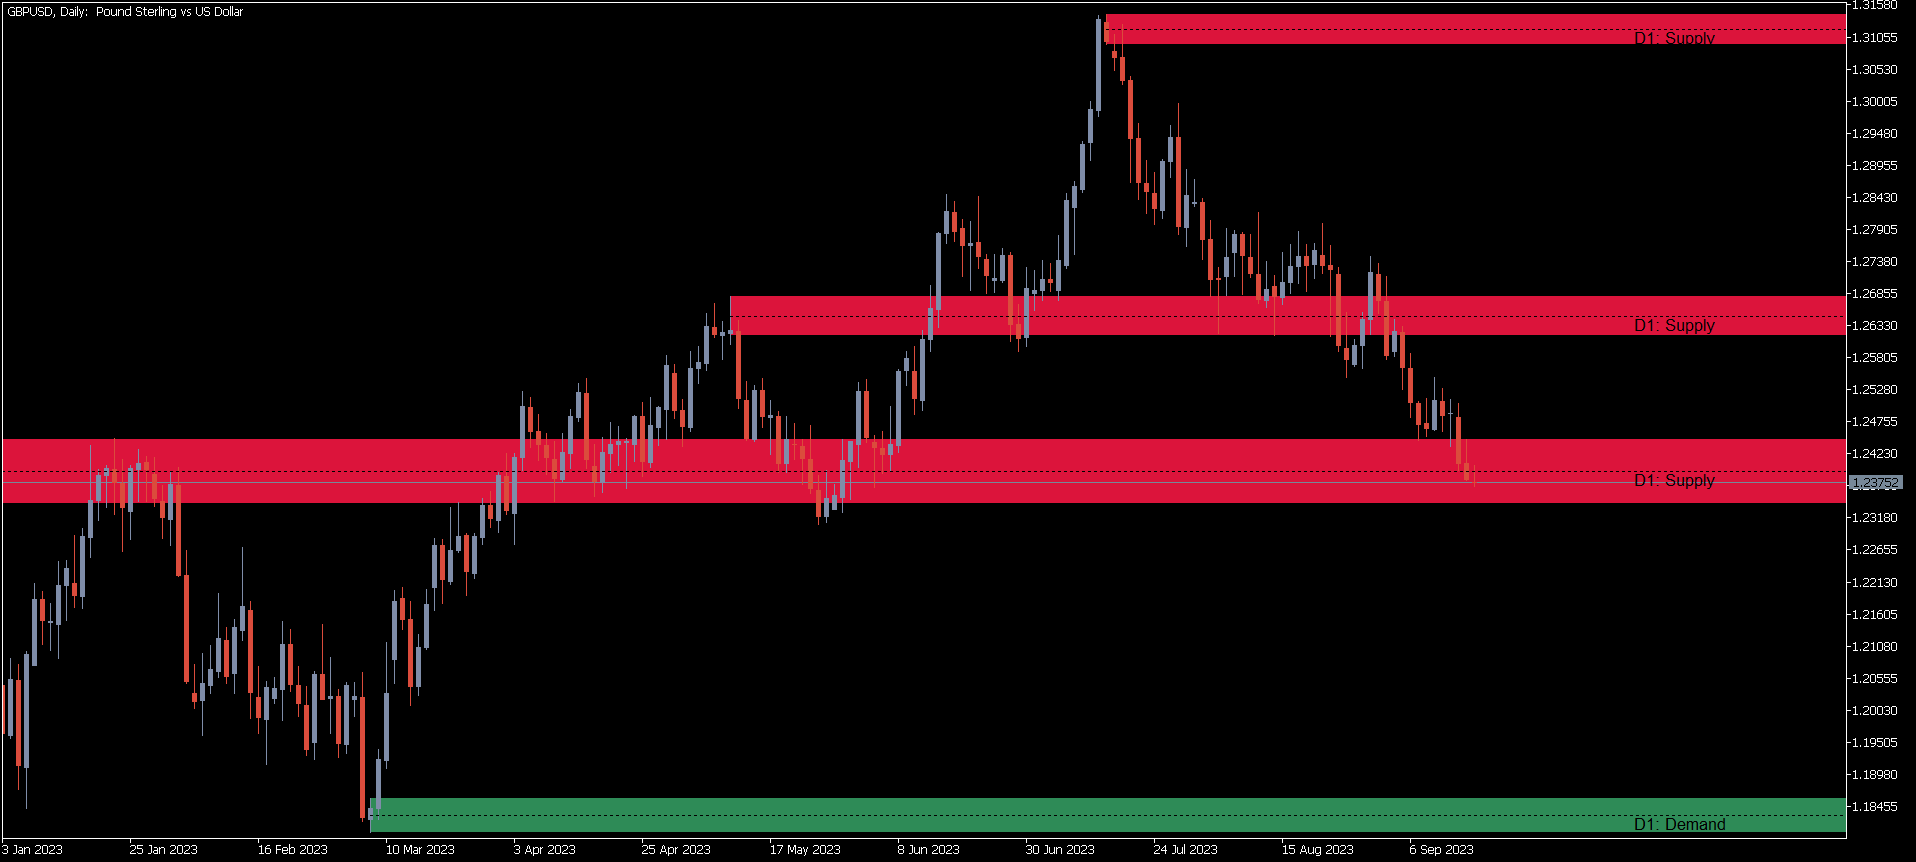
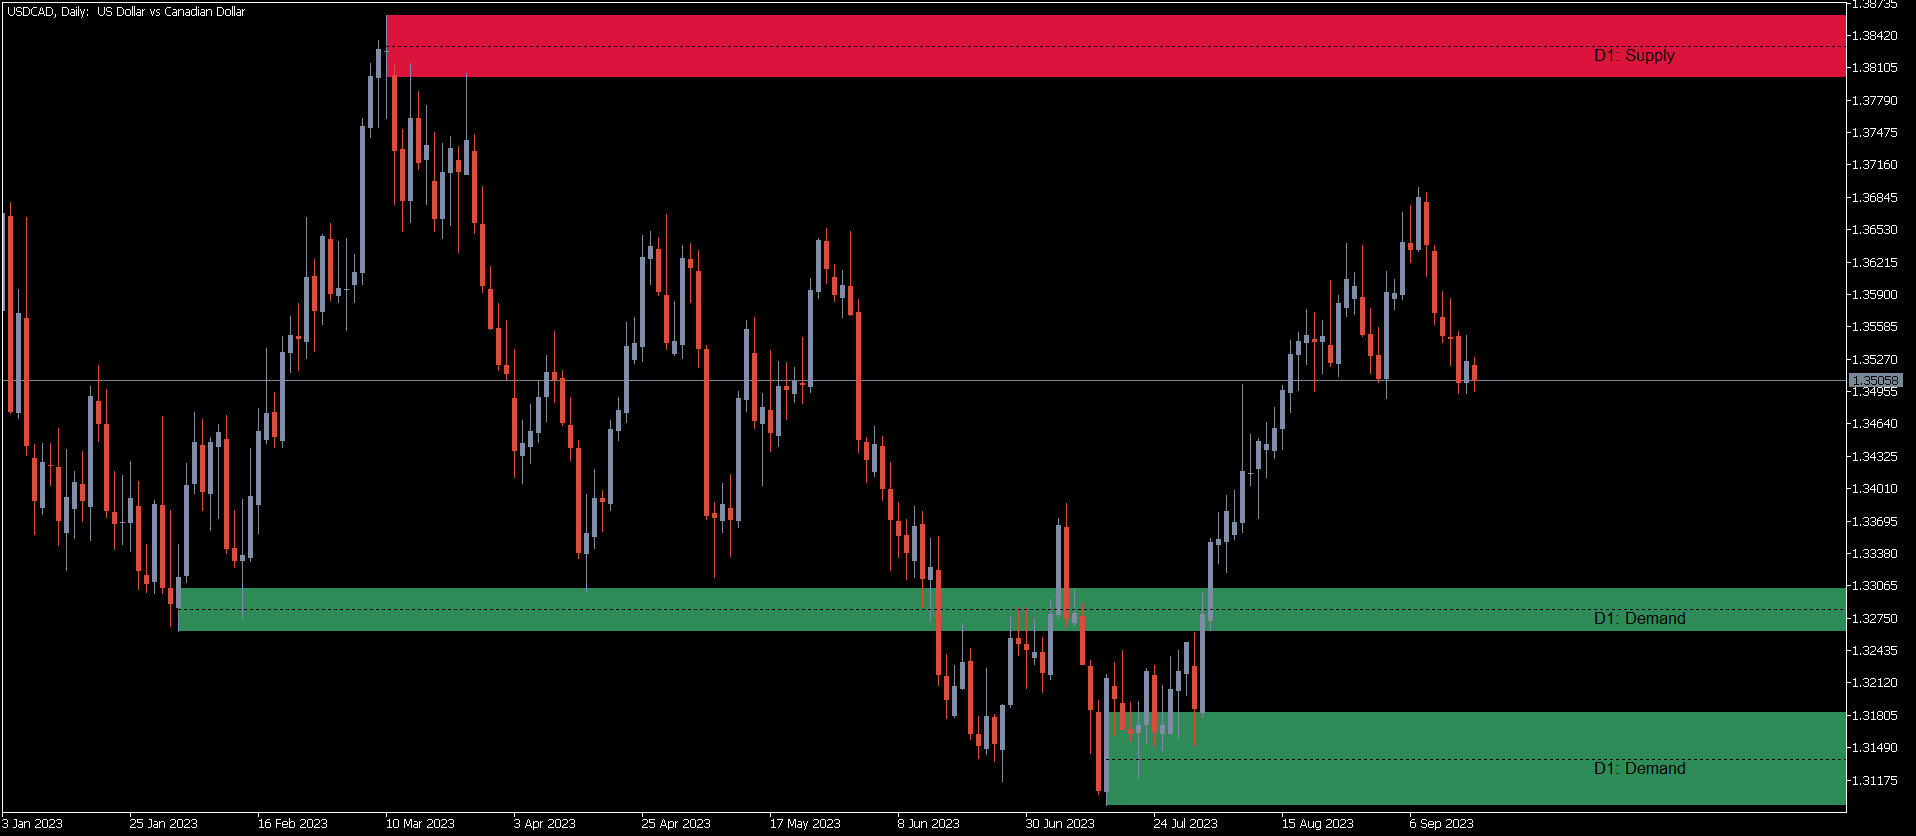
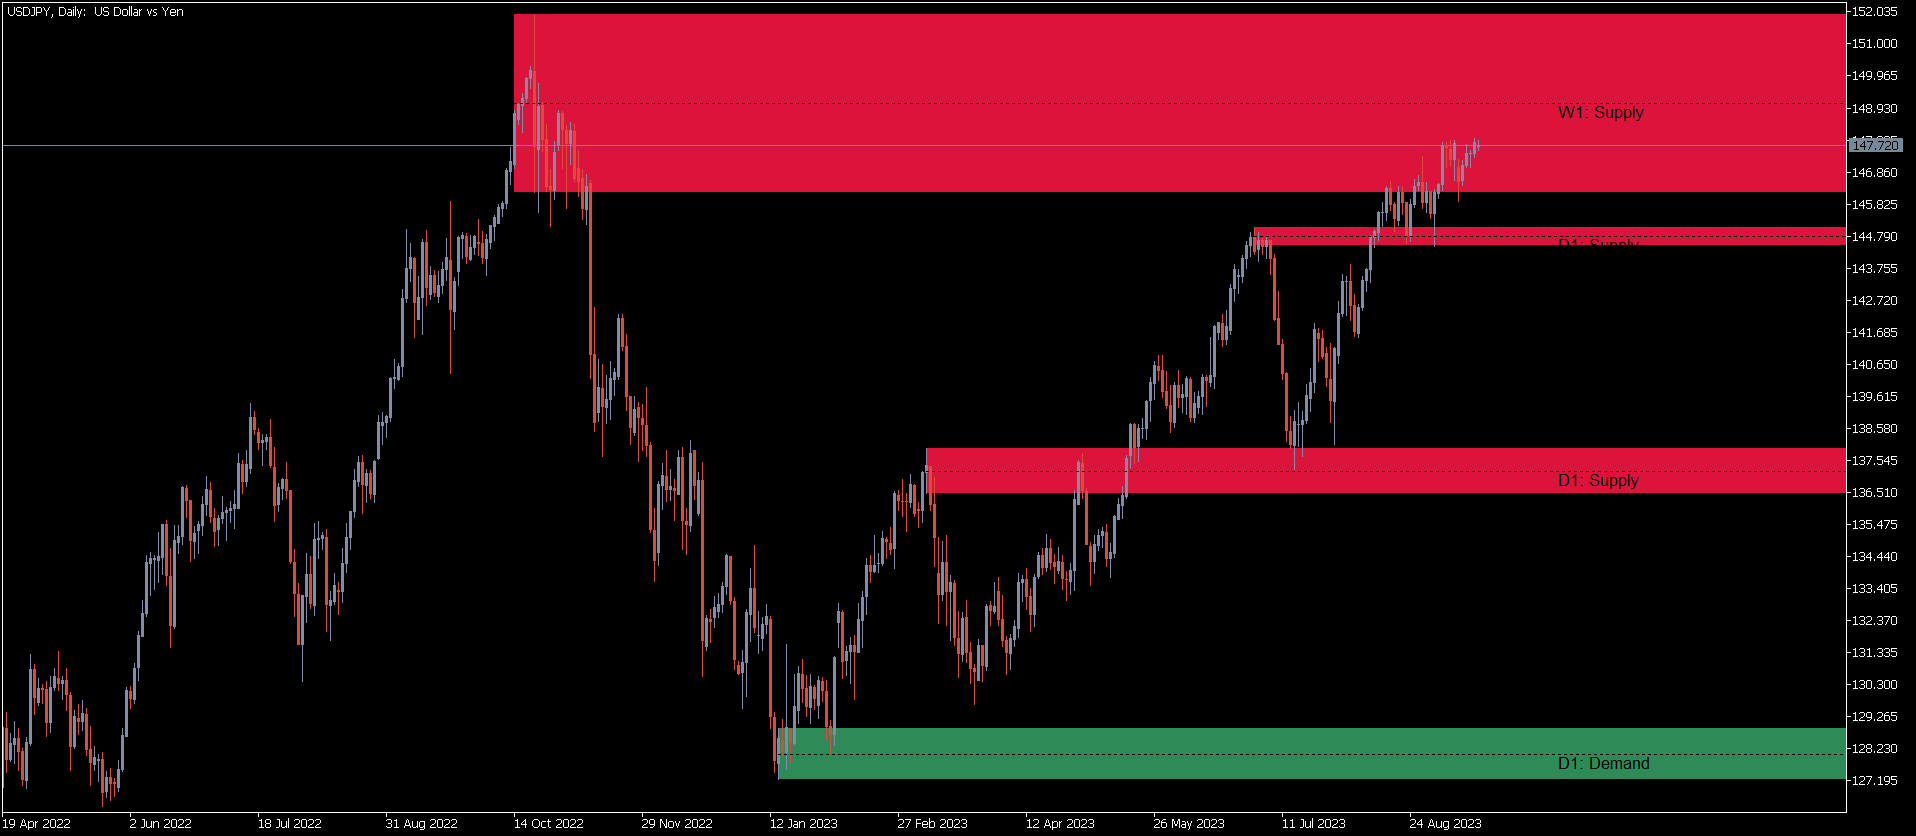
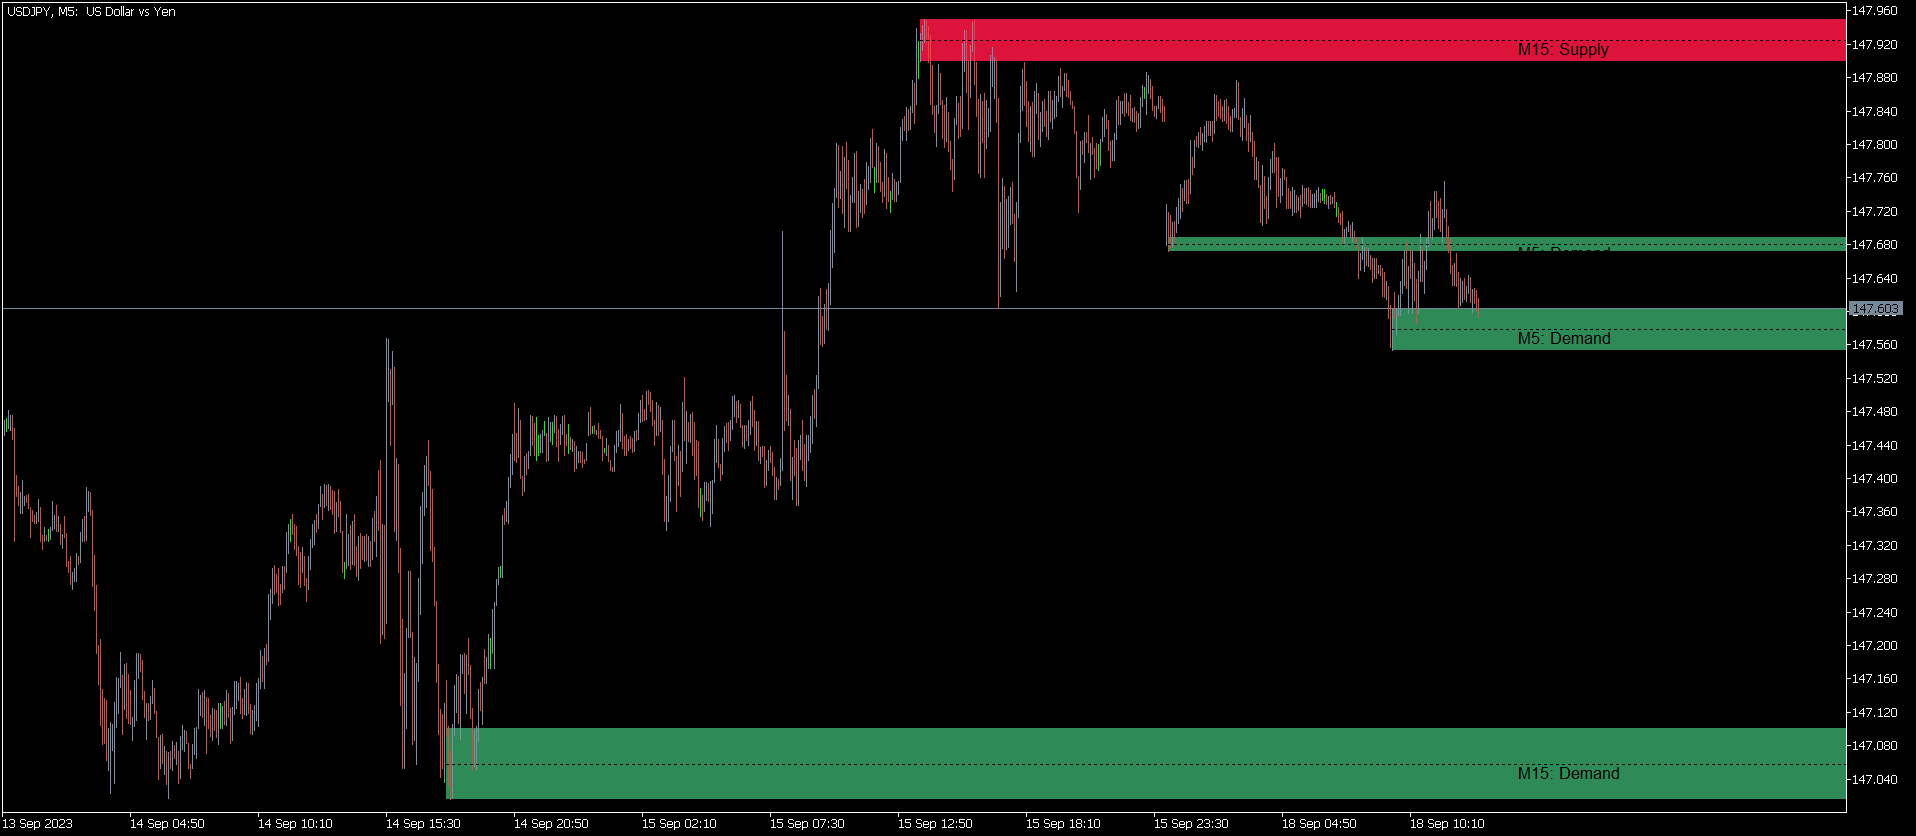
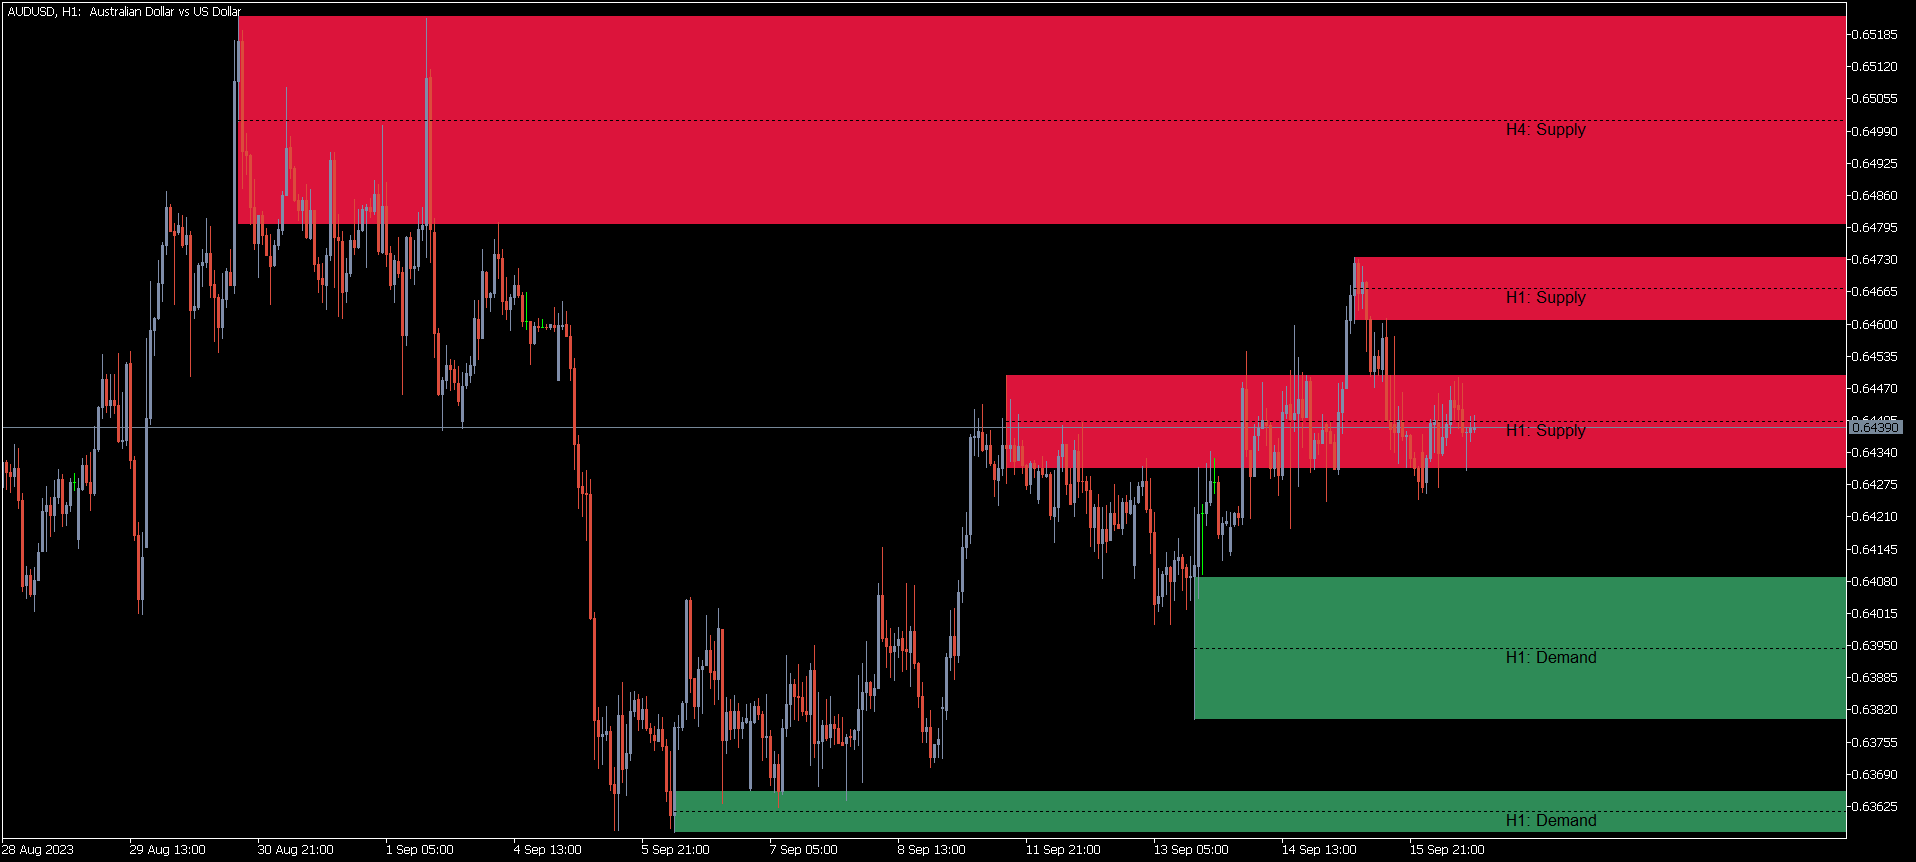
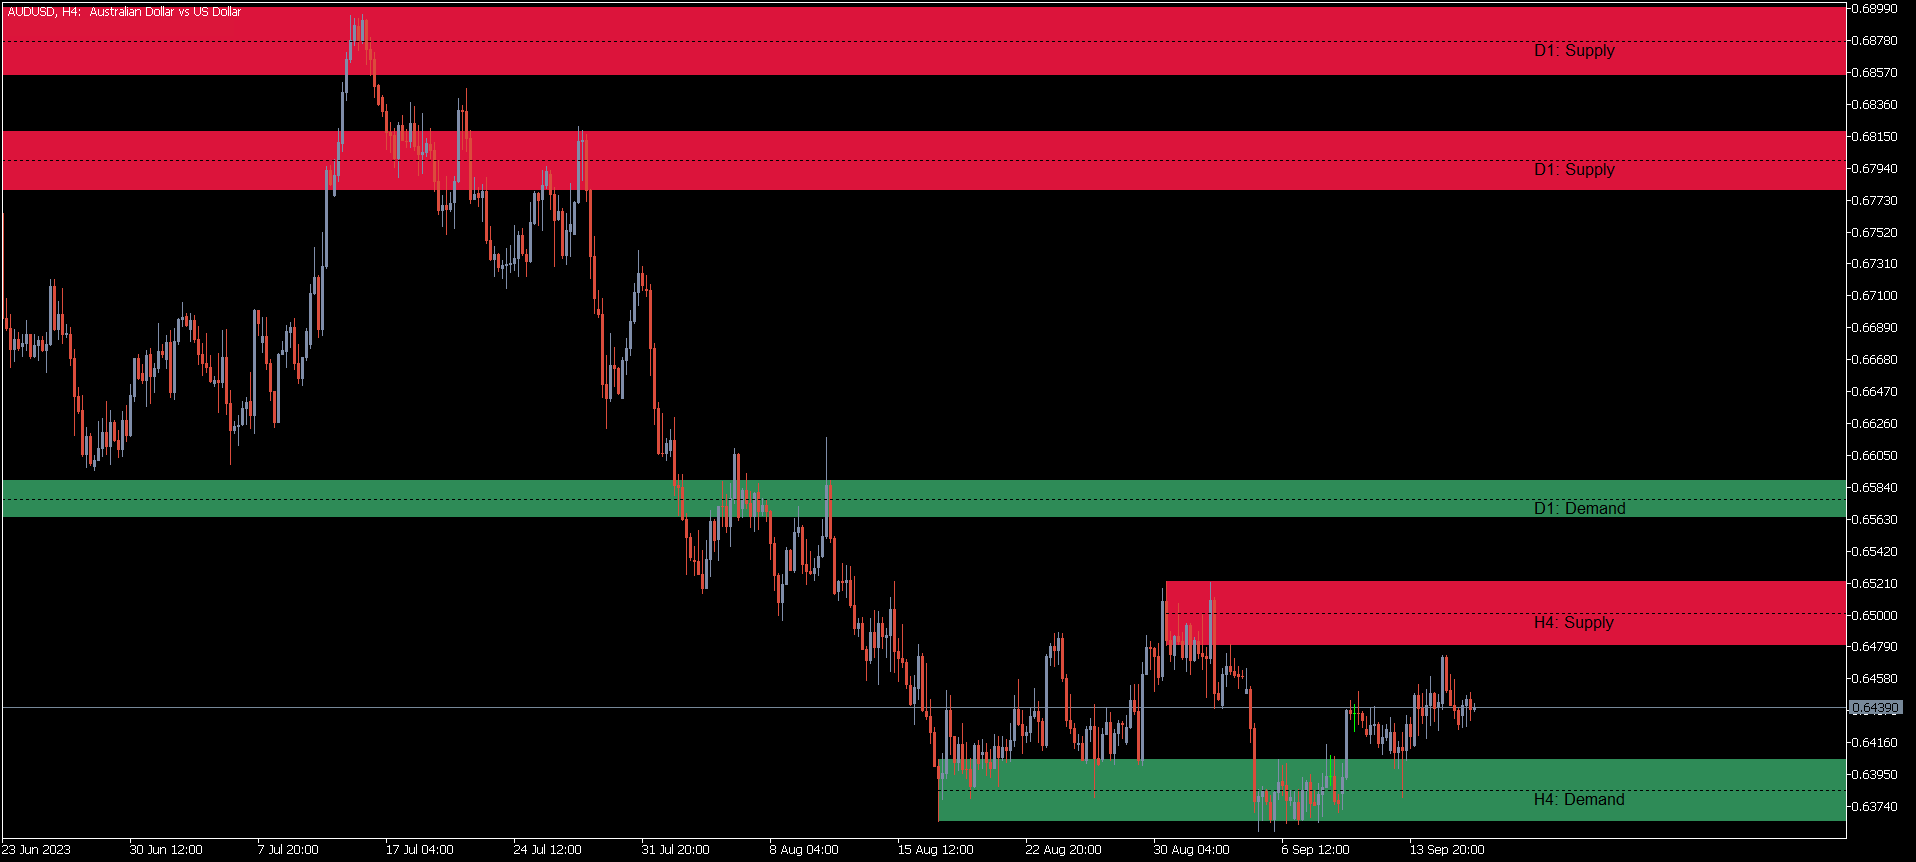
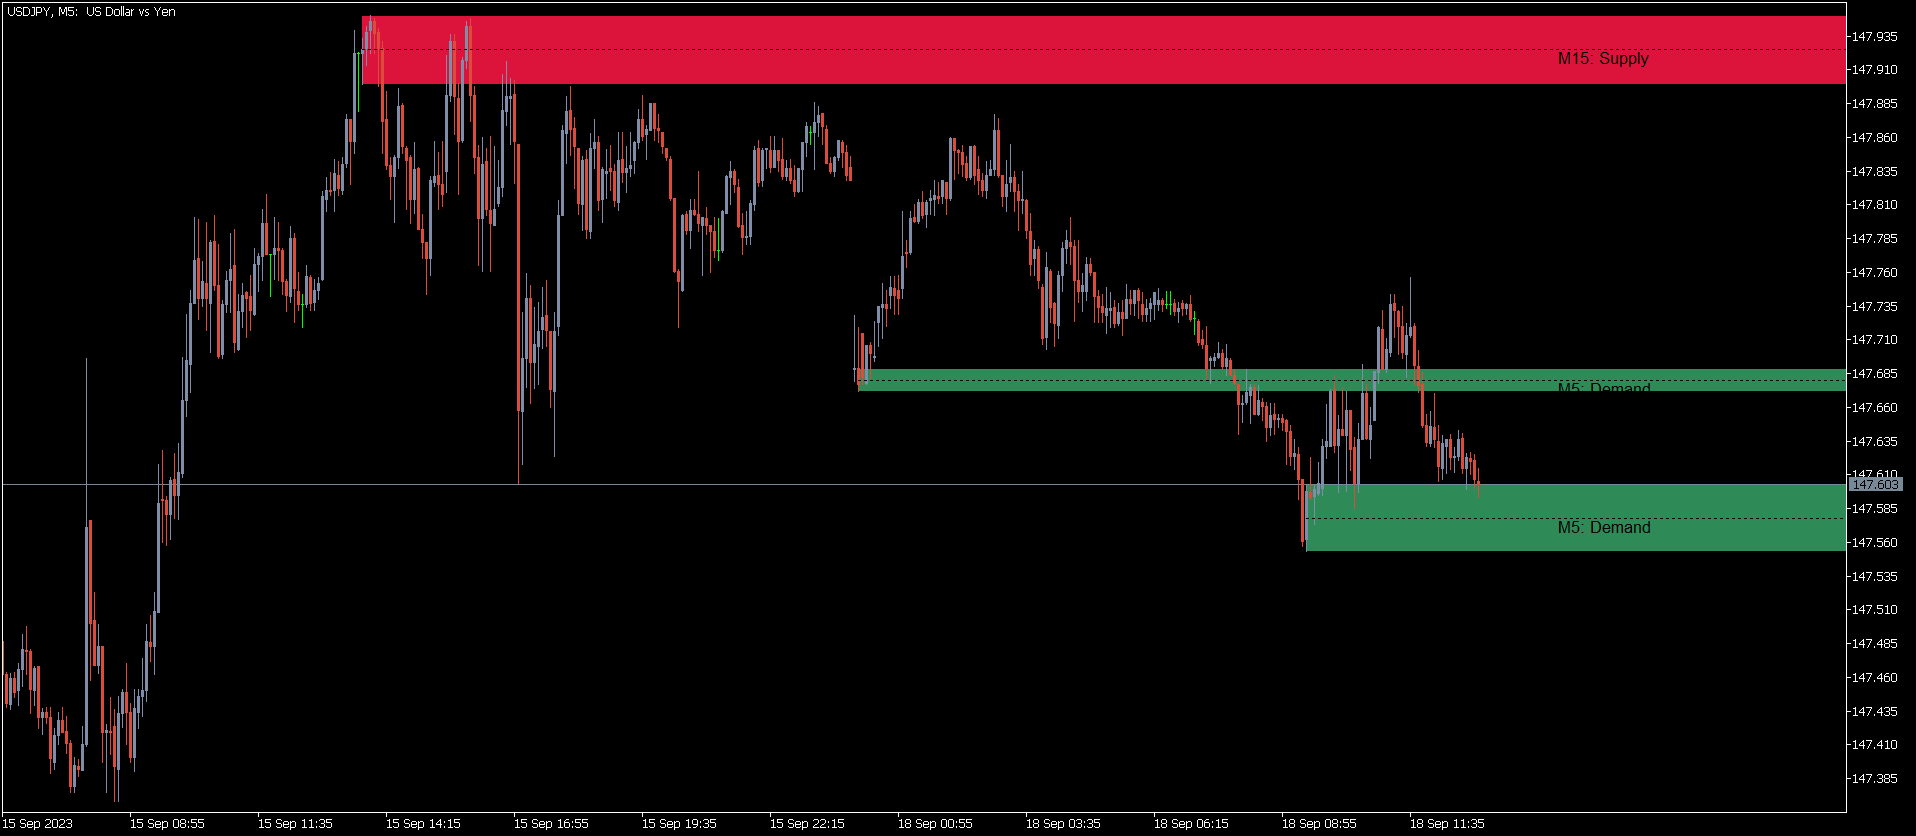
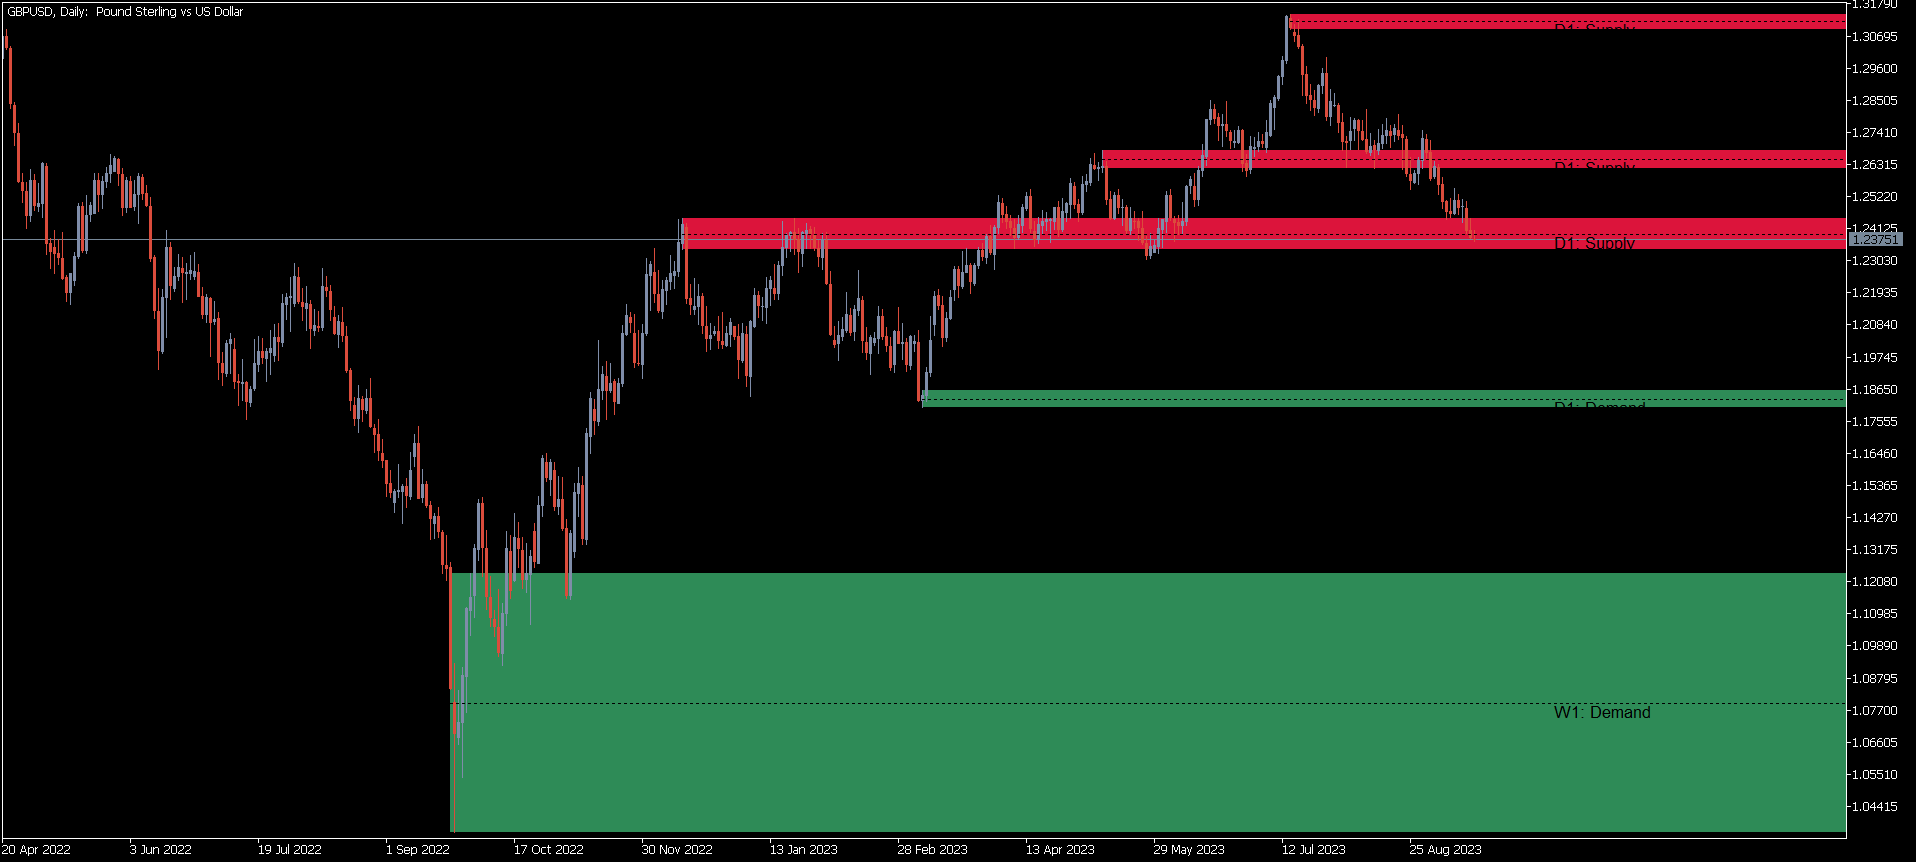
Der KT Supply and Demand Indikator erkennt und markiert zentrale Angebots- und Nachfragezonen. Er analysiert Swing-Punkte und kombiniert sie mit einer Mehrzeitrahmen-Analyse, sodass nur die wirklich wichtigen Bereiche hervorgehoben werden.
Mit dieser Methode werden Zonen sichtbar, in denen der Preis voraussichtlich dreht, weil dort zuletzt ein deutlicher Angebots- bzw. Nachfrageschwerpunkt entstanden ist.
Funktionen
- Präzise Analyse: Der verfeinerte Algorithmus lokalisiert die entscheidenden Zonen, die oft größere Preisschübe auslösen.
- Umfassender Marktüberblick: Zeigt Zonen aus bis zu drei Zeitrahmen und bietet so eine vollständige Marktperspektive.
- Aufgeräumtes Chartbild: Verhindert Überschneidungen von Zonen und hält das Chart klar und lesbar.
- Integrierte Vorlage: Eine vordefinierte Chartvorlage passt perfekt zum Indikator und verbessert die Visualisierung.
- Prognosestärke: Eine Markierung in jeder Zone weist früh auf mögliche Preisumkehr hin.
- Anpassbare Farben: Farben der Zonen können flexibel an die Marktbewegung angepasst werden.
- Persönliche Einstellungen: Breite Optionen zur Anpassung von Intensität, Farbe und Linienstärke.
- Aktive Benachrichtigungen: Pop-ups, Push-Nachrichten, Emails und Sounds warnen, sobald der Preis eine Zone ansteuert.
Anwendungen
Präzise Trades und Timing: Nutzt die Zonen und Alerts, um Ein- und Ausstiege punktgenau zu timen.
Stärkung der technischen Analyse: Klare Zonen helfen bei Unterstützung, Widerstand, Stop-Loss, Ziel und Breakout-Bewertung.
Besseres Risiko- und Trade-Management: Das Wissen um aktive Käufer- oder Verkäuferbereiche schärft das Risikoprofil.
Vielseitige Strategien: Ob Trend- oder Swing-Trading, der Indikator ergänzt beide Ansätze und erhöht Prognose und Profitabilität.
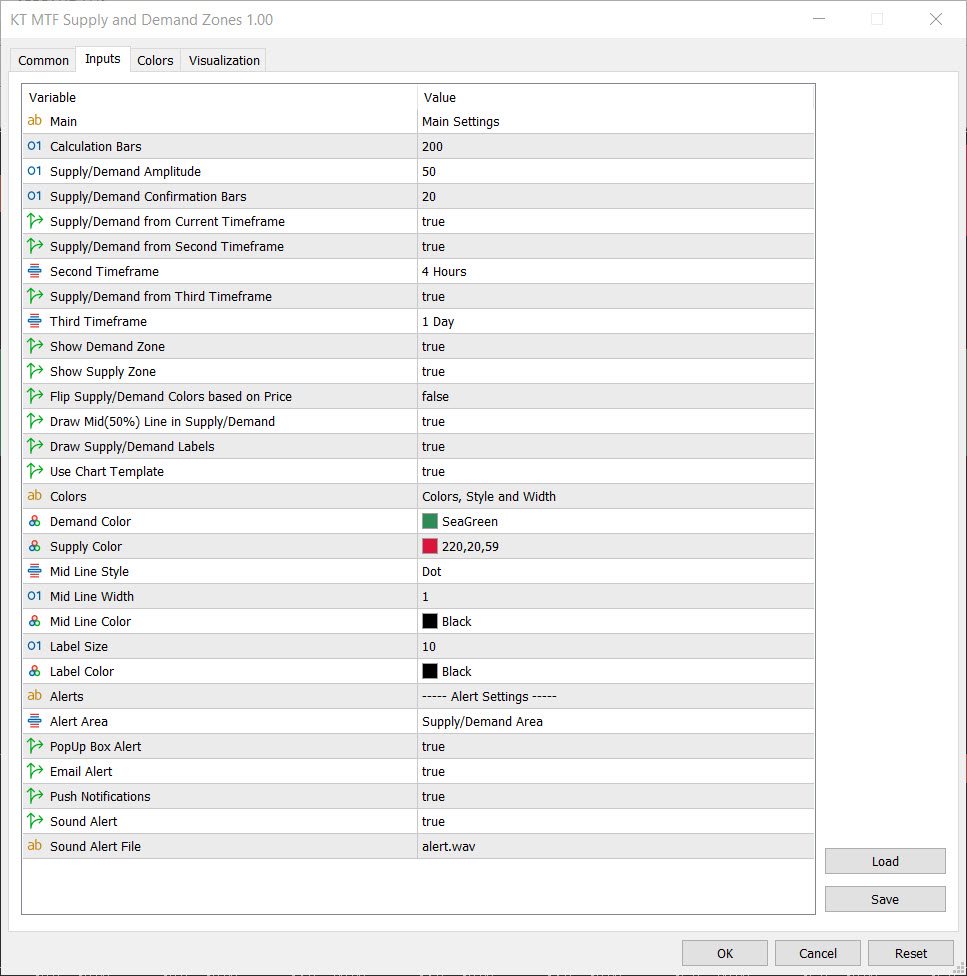
Indikatoreingaben
- Berechnungsbalken: Anzahl Balken für die Zonensuche; jüngere Balken wirken stärker.
- Angebot/Nachfrage-Amplitude: Große Werte = weniger, klarere Zonen; kleine Werte = mehr Zonen.
- Bestätigungsbalken: Mehr Balken ergeben stärkere Zonen.
- Zonen aktueller Zeitrahmen: Zonen des aktuellen Charts anzeigen.
- Zonen zweiter/dritter Zeitrahmen: Zonen anderer gewählter TF anzeigen.
- Nur Angebot oder Nachfrage: Wahlweise nur eine Art Zone zeigen.
- Farben anhand Preis wechseln: Farben ändern sich mit dem Kursverlauf.
- 50 %-Linie zeichnen: Mittellinie in jeder Zone anzeigen.
- Chartvorlage nutzen: Speziell abgestimmte Vorlage aktivieren.