Panic Meter
- Indikatoren
- Version: 1.0
- Aktivierungen: 5

Der Indikator misst die Häufigkeit der eingehenden Ticks, um die Marktaktivität zu analysieren. Bullische und bearische Ticks werden getrennt analysiert und geben Aufschluss über die derzeit vorherrschende Marktstimmung. Beobachtungen zufolge deutet ein Anstieg der Tickfrequenz (Panik) auf den Beginn starker Kursveränderungen hin, und ein Anstieg der Tickfrequenz in eine bestimmte Richtung begleitet nicht nur eine Kursveränderung in diese Richtung, sondern nimmt sie oft auch vorweg.
Der Indikator ist für das Scalping unverzichtbar.
Besondere Merkmale
- Höhere Empfindlichkeit des Indikators und eine geringe Verzögerung. Bei der Analyse von Ticks ist das Wissen, dass die Aktivität vor fünf Minuten zugenommen hat, gleichbedeutend mit dem Nichtwissen.
- Anzeige in Form eines Stufendiagramms, das es ermöglicht, den Verlauf der Frequenzänderungen zu verfolgen.
- Anzeige der durchschnittlichen Frequenz für die vorhergehenden Perioden, was die Aussagekraft des Diagramms erhöht.
- Getrennte Anzeige von aufsteigenden und absteigenden Tick-Frequenzen.
Erscheinungsbild und Verwendung
Der Chart berechnet die Indikatorwerte einmal pro Sekunde neu. Alle Indikatorwerte sind in 1/min ausgedrückt.
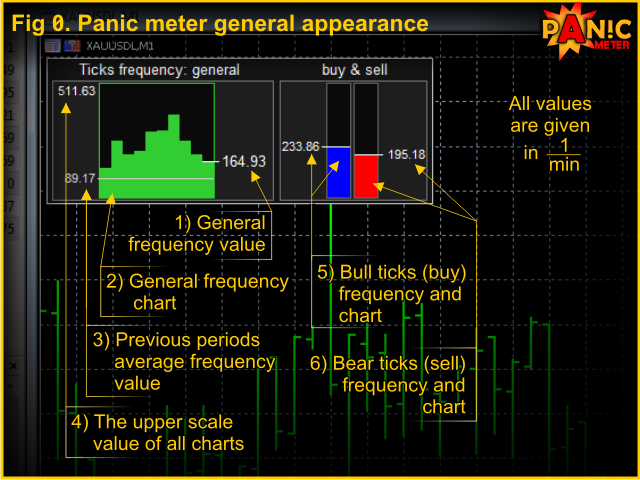
Die Indikatorschnittstelle besteht aus den folgenden Elementen (siehe Abb. 0):
- Der aktuelle Wert der Frequenz der eingehenden Ticks wird auf der rechten Seite des Frequenzdiagramms angezeigt.
- Das Hauptfrequenzdiagramm. Hier werden die letzten zehn Werte der Tickfrequenz angezeigt. Wenn die aktuelle Frequenz den Durchschnittswert (siehe unten) übersteigt, was auf einen aktiven Markt hinweist, wird der Diagrammrand grün.
- Der durchschnittliche Frequenzwert des aktuellen Zeitraums wird links im Diagramm und als graue horizontale Ebene im Diagramm angezeigt. Er wird als die durchschnittliche Häufigkeit der Ticks für die aktuellen 30 Minuten über die letzten 10 Tage berechnet.
- Die obere Grenze der Chart-Skala wird in der oberen linken Ecke angezeigt. Die Charts aller drei Frequenzen haben die gleiche vertikale Skala. Obwohl die Häufigkeitswerte der bullischen und bearischen Ticks nach einer etwas anderen Formel berechnet werden, erleichtert dieser Wert die visuelle Orientierung.
- Der Indikator für die Häufigkeit aufsteigender (bullischer) Ticks ist der linke (blaue) Chart, der Zahlenwert befindet sich links davon. Die Berechnungsformel bezieht nicht nur die Anzahl der Ticks und die Zeit, sondern auch den Preis mit ein. Korrekter wäre es daher, von der Häufigkeit der positiven Kursveränderungen in Punkten zu sprechen. Wenn es deutlich mehr aufsteigende als absteigende Ticks gibt (was auf eine starke "bullische" Stimmung im Moment hinweist), wird die Grenze blau.
- Der Häufigkeitsindikator für die absteigenden (bärischen) Ticks ist das rechte (rote) Diagramm. Verhalten und Berechnung sind ähnlich wie bei Punkt 5.
Eingabeparameter
Der Indikator verwendet keine Eingabeparameter und muss nicht konfiguriert werden.
Starten des Indikators
Ziehen Sie den Indikator auf den gewünschten Chart. Beim Start wird der Indikator in der oberen linken Ecke angezeigt, aber Sie können ihn per Doppelklick an die gewünschte Stelle verschieben. Der Indikator muss 15 Ticks empfangen, bevor er visualisiert werden kann (die Anzahl der verbleibenden Ticks bis zum Start wird in der Kopfzeile angezeigt).