Panic Meter
- Indicadores
- Versión: 1.0
- Activaciones: 5

El indicador mide la frecuencia de los ticks entrantes para analizar la actividad del mercado. Los ticks alcistas y bajistas se analizan por separado, informando sobre el sentimiento del mercado predominante en ese momento. Según las observaciones, un aumento de la frecuencia de los ticks (pánico) indica el comienzo de fuertes cambios de precios, y un aumento de la frecuencia de los ticks en una dirección determinada no sólo acompaña a un cambio de precios en esta dirección, sino que a menudo lo anticipa.
El indicador es indispensable para el scalping.
Características distintivas
- Mayor sensibilidad del indicador y un pequeño retardo. Al analizar los ticks, saber que la actividad había aumentado hace cinco minutos equivale a no saberlo.
- Visualización en forma de gráfico escalonado, que permite ver el historial de cambios de frecuencia.
- Visualización de la frecuencia media de los periodos anteriores, lo que aumenta la informatividad del gráfico.
- Visualización separada de las frecuencias de tick ascendentes y descendentes.
Aspecto y uso
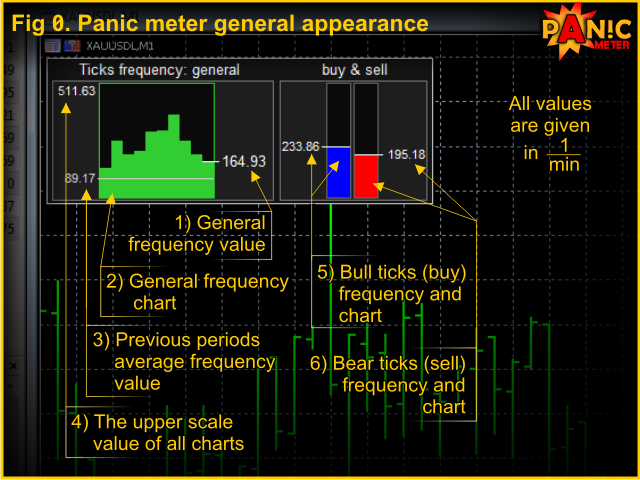
El gráfico recalcula los valores de los indicadores una vez por segundo. Todos los valores de los indicadores se expresan en 1/min.
La interfaz del indicador consta de los siguientes elementos (véase la Fig. 0):
- El valor actual de la frecuencia de ticks entrantes se muestra a la derecha del gráfico de frecuencias.
- El gráfico de frecuencia principal. Visualiza los diez últimos valores de frecuencia de ticks. Cuando la frecuencia actual supera la media (véase más abajo), lo que significa que el mercado está activo, el borde del gráfico se vuelve verde.
- El valor de la frecuencia media del periodo actual se muestra a la izquierda del gráfico y como un nivel horizontal gris en el gráfico. Se calcula como la frecuencia media de los ticks de los 30 minutos actuales en los últimos 10 días.
- El límite superior de la escala del gráfico se muestra en la esquina superior izquierda. Los gráficos de las tres frecuencias tienen la misma escala vertical. Aunque los valores de frecuencia de los ticks alcistas y bajistas se calculan según una fórmula ligeramente diferente, este valor facilita la orientación visual.
- El indicador de frecuencia de los ticks ascendentes (alcistas) es el gráfico de la izquierda (azul), el valor numérico se encuentra a la izquierda del mismo. La fórmula de cálculo implica no sólo el número de ticks y el tiempo, sino también el precio. Por lo tanto, sería más correcto llamarla frecuencia de cambios positivos del precio en puntos. Si hay muchos más ticks ascendentes que descendentes (lo que indica un fuerte sentimiento "alcista" en este momento), el borde se vuelve azul.
- El indicador de frecuencia de los ticks descendentes (bajistas) es el gráfico de la derecha (rojo). El comportamiento y el cálculo son similares a los del punto 5.
Parámetros de entrada
El indicador no utiliza parámetros de entrada y no requiere configuración.
Inicio del indicador
Arrastre el indicador al gráfico deseado. Al iniciarse, el indicador se muestra en la esquina superior izquierda, pero puede hacer doble clic sobre él y moverlo a la ubicación deseada. El indicador necesita recibir 15 ticks antes de poder ser visualizado (el número de ticks restantes antes del inicio se muestra en la cabecera).