XR Combo
- Göstergeler
- Sürüm: 1.0
- Etkinleştirmeler: 5

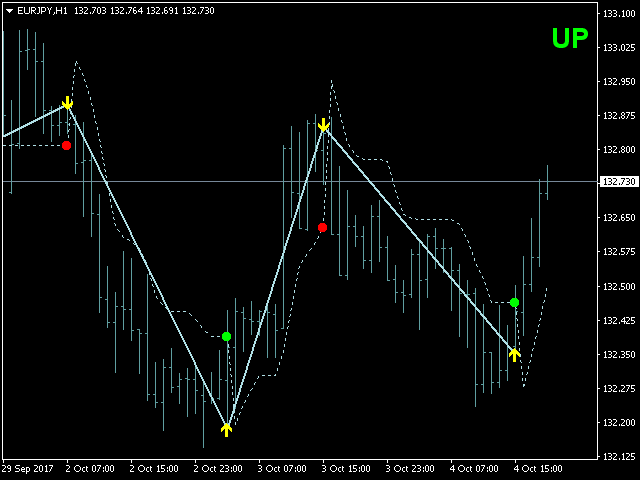
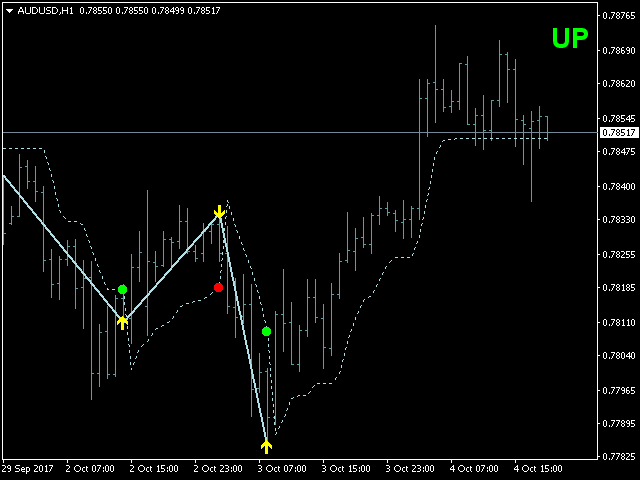
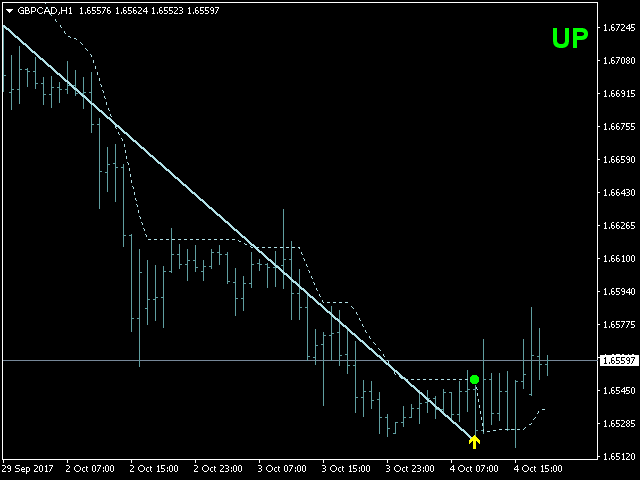
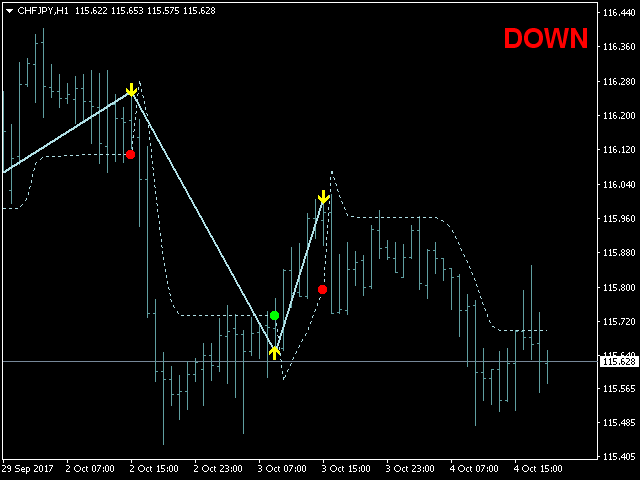
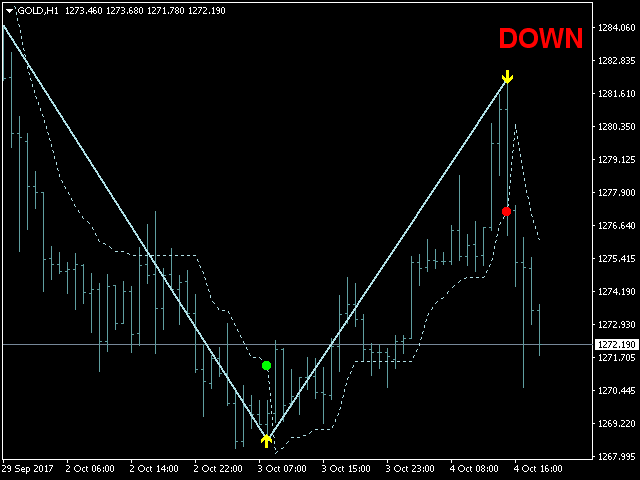
This indicator displays the trend movements.
Parameters
- XRMultiplier: XR multiplier.
- Line: line movement (true/false).
- XRzak: XRzak movements (true/false).
- Arrow1: arrow movements (true/false).
- Arrow2: arrow movements up and down (true/false).
- Trend: trend movements (true/false).
- X: move the trend left and right.
- Y: move the trend up and down.
How to understand the status:
- If the arrow is green, trend is up.
- If the arrow is red, trend is down.