BoughtOverSold
- Indikatoren
- Version: 2.8
- Aktualisiert: 18 September 2017
- Aktivierungen: 5

Der Begriff "überkauft" beschreibt einen Zeitraum, in dem es über einen bestimmten Zeitraum hinweg zu einer signifikanten und beständigen Aufwärtsbewegung der Kurse gekommen ist, ohne dass es zu größeren Rücksetzern kam.
Der Begriff "überverkauft" beschreibt einen Zeitraum, in dem sich der Kurs über einen bestimmten Zeitraum hinweg deutlich und beständig nach unten bewegt hat, ohne dass es zu größeren Rücksetzern kam.
Da sich der Kurs nicht ewig in eine Richtung bewegen kann, wird er irgendwann umkehren.
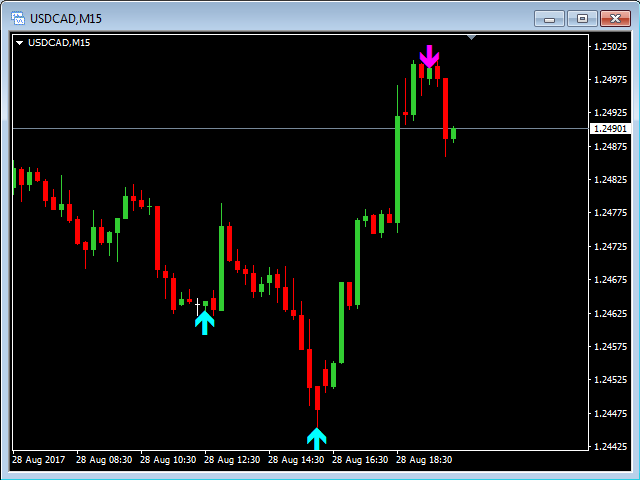
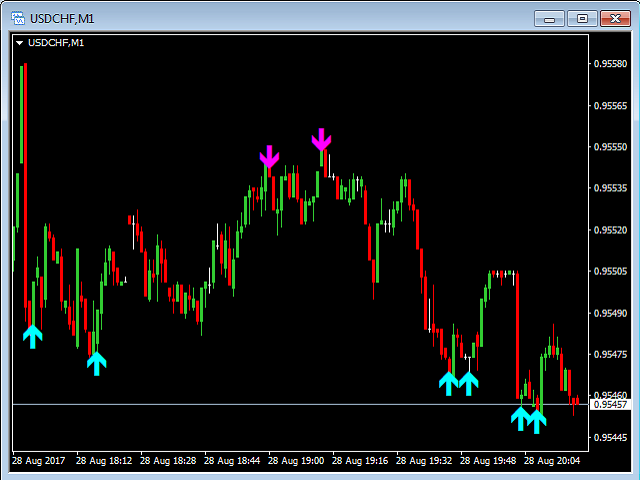
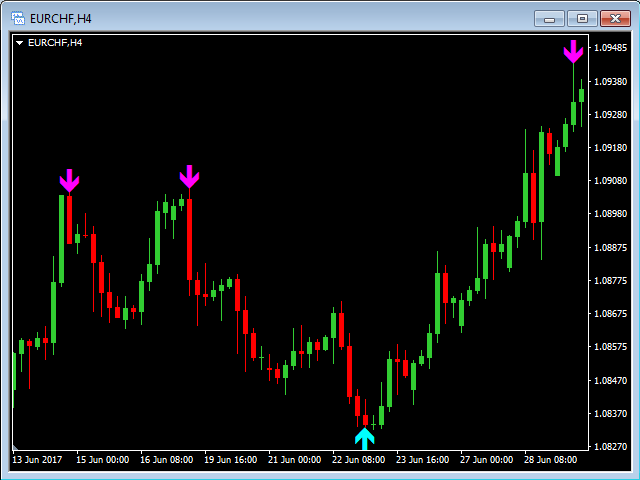
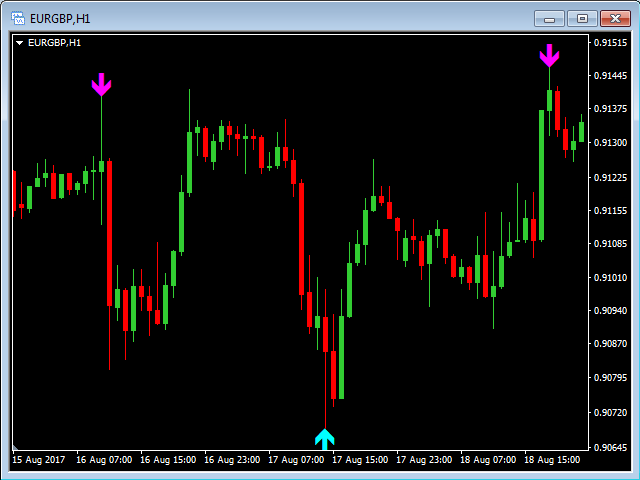
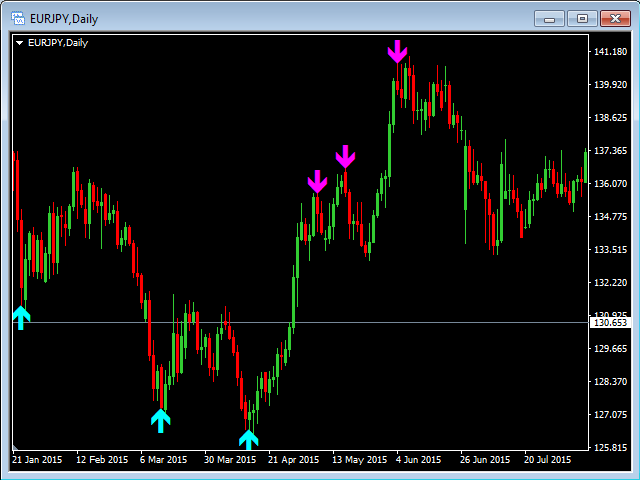
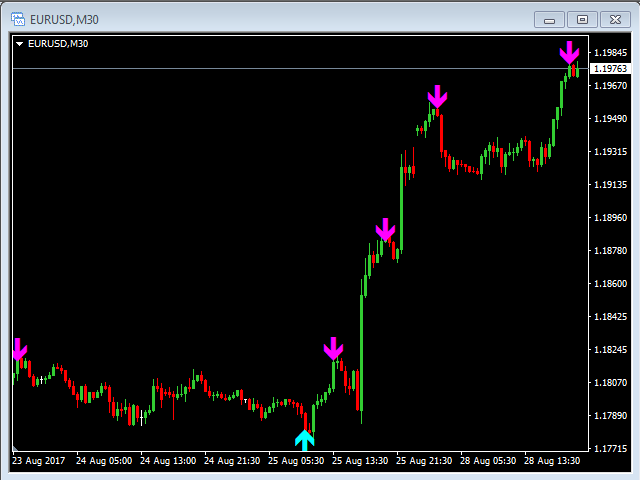
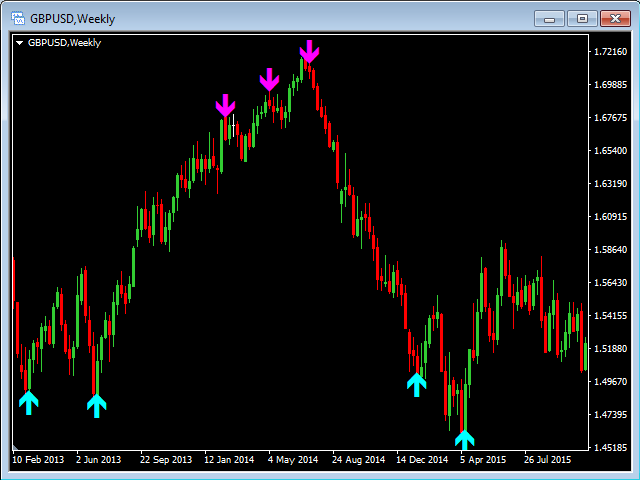
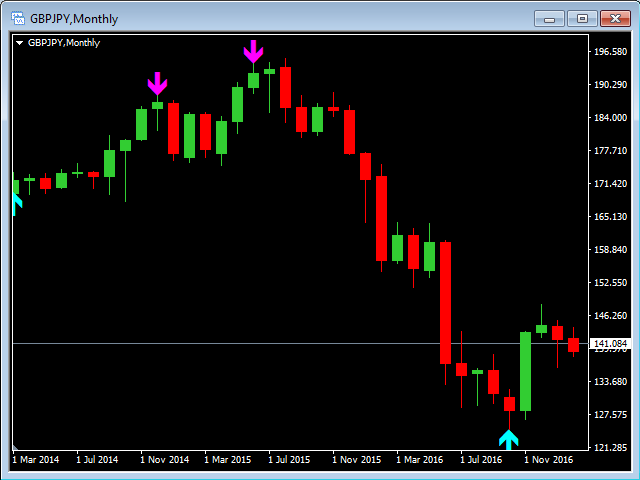
Dieser Indikator zeigt einen magentafarbenen Pfeil im Falle eines überkauften Zustands und einen aquafarbenen Pfeil im Falle eines überverkauften Zustands an.
Wenn der Eingabeparameter AlertsEnabled auf true gesetzt ist, zeigt der Indikator eine Warnmeldung in einem separaten Fenster mit Symbol, TimeFrame und OverBought oder Oversold Statement an.
Eingabe-Parameter
- AlertsEnabled - Wenn true, dann wird ein Alert angezeigt.