Round price levels alert
- Indikatoren
- Version: 5.2
- Aktualisiert: 4 Januar 2024
- Aktivierungen: 10

Ein Indikator für runde Niveaus. Eine Reihe von wichtigen Kursniveaus mit Ton- und Textwarnungen, die erzeugt werden, wenn der aktuelle Geldkurs eines Währungspaares einer runden Zahl entspricht.
Dieser Indikator zeigt dem Händler visuell die wahren Unterstützungs- und Widerstandsniveaus, die von den meisten Händlern und Handelsrobotern verwendet werden.
Der Vorteil dieses Indikators ist, dass der Händler, der diesen Indikator auf einem Diagramm verwendet, keine zusätzlichen Niveaus einzeichnen muss.
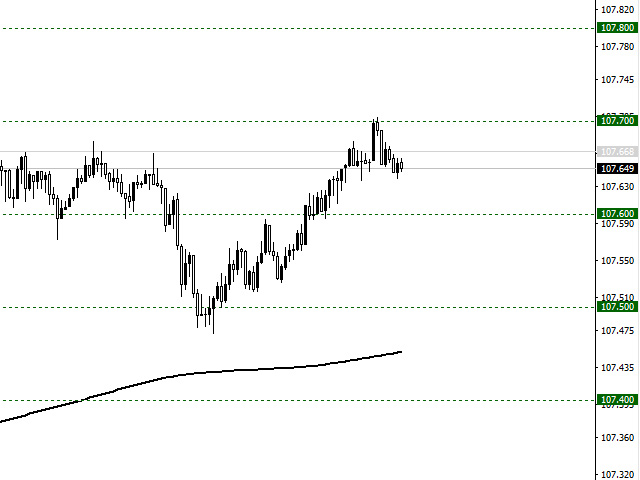
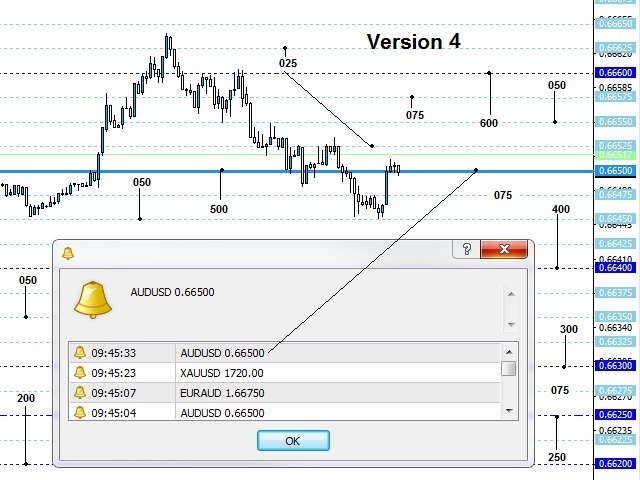
Runde Kursniveaus stellen eine gewisse Barriere dar, so dass wir sagen können, dass Kurswerte, die ein Vielfaches von hundert (00) sind, als Unterstützungs-/Widerstandsniveaus für den Kurs verwendet werden können.
Wie die runden Niveaus funktionieren
Für Anleger, die mit höheren Zeitrahmen oder kleineren Intraday-Zeitrahmen arbeiten, ist es einfacher, sich die runde Zahl zu merken, indem sie die Preisdynamik von Finanzinstrumenten verfolgen.
Dies ist ein allgemeiner menschlicher Wunsch, die Dinge zu vereinfachen. Auch Trader bevorzugen einfachere Wege. Deshalb sind die Hundertfachen so attraktiv.
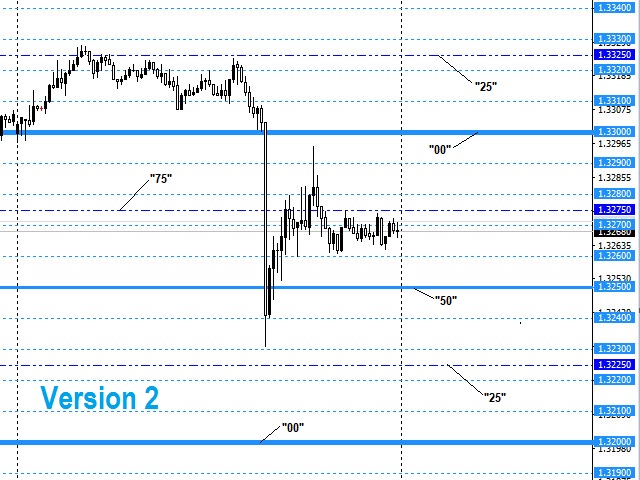
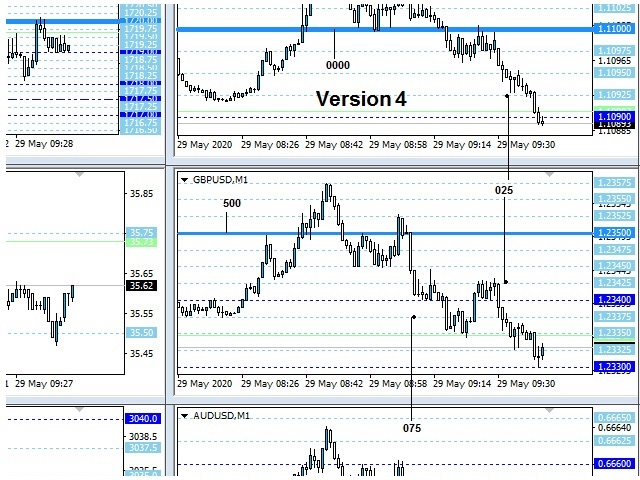
Der eigentliche Kampf zwischen Bullen und Bären findet also oft bei Werten wie 1,23000, 1,4000, 1,23500 usw. statt.
Indem wir auf der Grundlage der Erholung oder des Zusammenbruchs auf diesen Niveaus bestimmen, wer in diesem Moment gewonnen hat, können wir uns der Mehrheit der offenen Aufträge auf dem Markt anschließen.
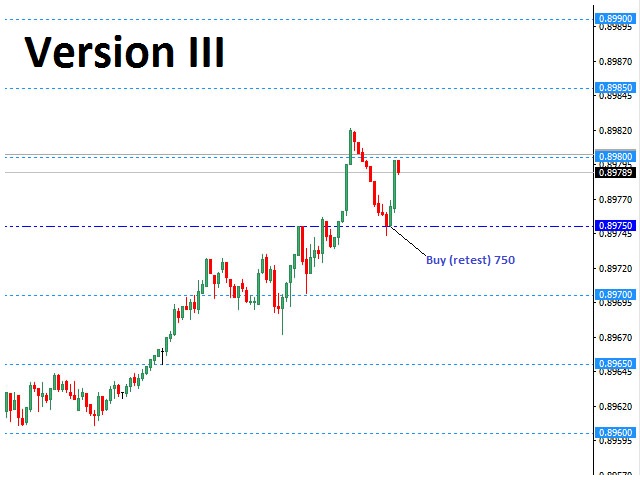
Bei der Eröffnung von Geschäften bei einem Ausbruch über diese Niveaus, was laut Statistik häufiger vorkommt, können wir einen Take Profit auf dem nächsten Kursniveau platzieren und so die Mindestreserve für die Kursbewegung festlegen.
Wenn der Preis bricht und sich in der Nähe eines runden Niveaus konsolidiert, können wir Geschäfte in Erwartung einer Fortsetzung der Bewegung eröffnen, da die Preisbarriere überschritten wurde, und einen Stop Loss hinter dem gebrochenen Niveau setzen und so unsere Risiken festlegen.
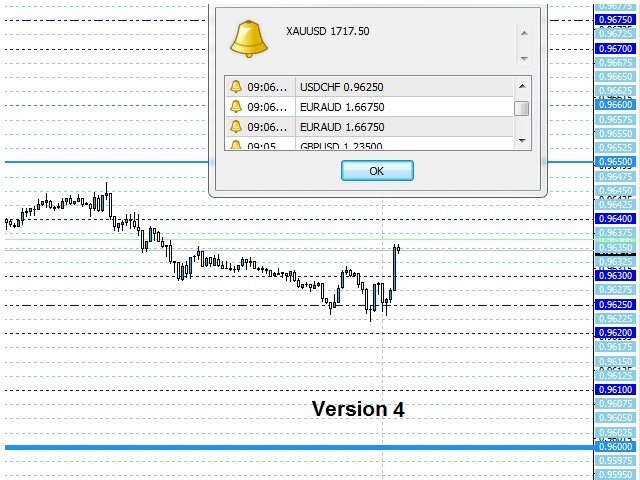
Ton- und Textwarnungen
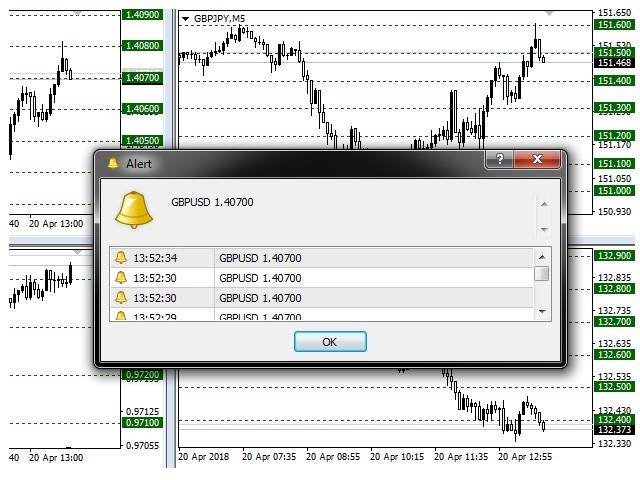
Alarme können in den Indikatorparametern aktiviert werden.
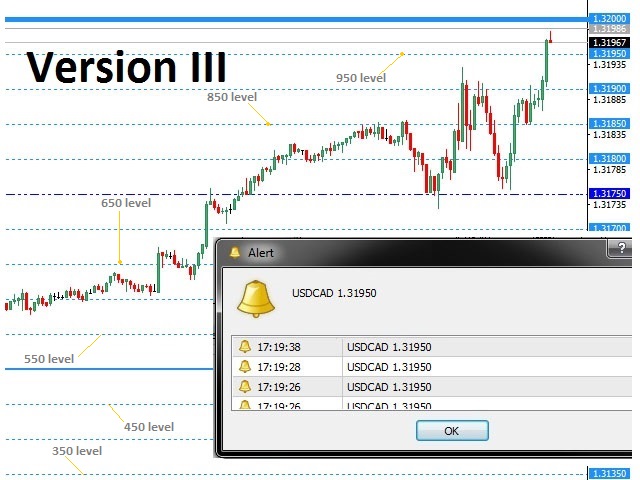
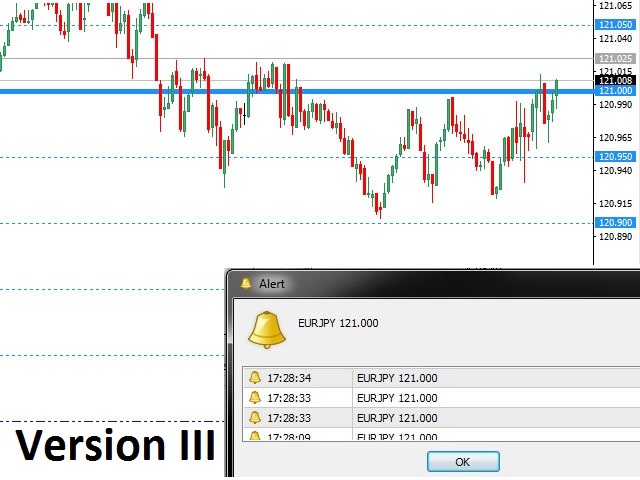
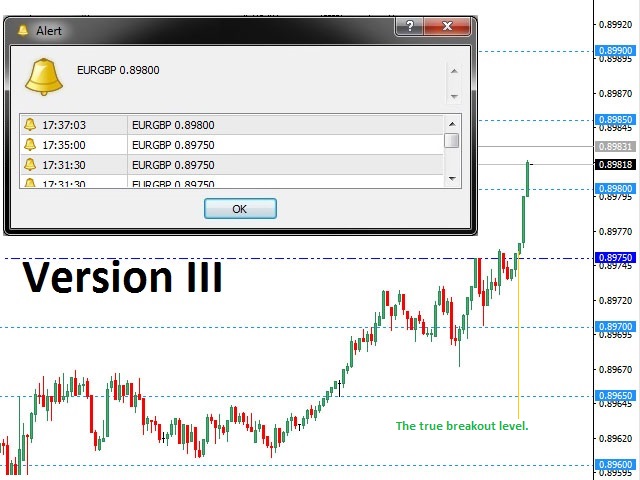
Wenn AlertPlay = true ist, zeigt der Indikator ein Dialogfeld an, wenn der Preis des Währungspaares ein rundes Niveau erreicht. Der Alarm enthält Informationen über das Währungspaar und den aktuellen Geldkurs.
Wenn ein Level berührt wird, wird außerdem der Standard-Sound "alert.wav" abgespielt.
Indikator-Eingabeparameter
- Show 00 Levels - zeigt das absolute runde Level an, Standard ist true.
- Show 10 Levels - zeigt ein rundes Vielfaches eines Hunderts an, Standardeinstellung ist true.
- 20 Stufen anzeigen - zeigt die 200. runde Stufe an, Standardwert ist wahr.
- 30 Stufen anzeigen - zeigt die 300. runde Stufe an, Voreinstellung ist wahr.
- 40 Stufen anzeigen - zeigt die 400. runde Stufe an, Voreinstellung ist wahr.
- 50 Ebenen anzeigen - zeigt die 500. Runde an, Standardeinstellung ist wahr.
- 60 Ebenen anzeigen - zeigt die 600. Ebene der Runde an, Standardeinstellung ist wahr.
- 70 Ebenen anzeigen - zeigt die 700. Ebene der Runde an, Standardeinstellung ist wahr.
- 80 Ebenen anzeigen - zeigt die 800. Runde an, Standardeinstellung ist wahr.
- 90 Ebenen anzeigen - zeigt die 900. Ebene der Runde an, Standardeinstellung ist wahr.
- 20 Ebenen anzeigen - zeigt die 200. runde Ebene an, Standardeinstellung ist wahr.
- Levels 00 Color - die Farbe des absoluten runden Levels, Standard ist DarkGreen.
- Levels 10 Color - die Farbe des runden Levels als Vielfaches von Hundert, Standardwert ist DarkGreen.
- Levels 20 Color - die Farbe des 200. runden Levels, Standardwert ist DarkGreen.
- Levels 30 Color - die Farbe des 300. runden Levels, Standard ist DarkGreen (Dunkelgrün).
- Levels 40 Color - die Farbe des 400. Rundenlevels, Standard ist DarkGreen.
- Level 50 Farbe - die Farbe des Levels der 500. Runde, Standard ist Dunkelgrün.
- Levels 60 Farbe - die Farbe des 600. Rundenlevels, Standard ist Dunkelgrün.
- Level 70 Farbe - die Farbe des Levels der 700. Runde, Standard ist Dunkelgrün.
- Levels 80 Color - die Farbe des 800. Rundenlevels, Standard ist DarkGreen.
- Levels 90 Color - die Farbe des 900. Round Levels, Standard ist DarkGreen.
- Breite 00; 10; 20; 30; 40; 50; 60; 70; 80; 90 - die Breite der runden Ebenen, Standardwert ist 1.
- Ebenenstil - die Stile der runden Ebenen mit der Breite von 1, Voreinstellung ist Dot.
- AlertPlay - Aktivieren/Deaktivieren des Ton- und Textalarms, Standardwert ist false (deaktiviert).
Hinweis: Der Indikator kann für alle Handelsinstrumente verwendet werden. Der empfohlene Zeitrahmen ist M15.
Runde Preisniveaus können auf höheren Zeitrahmen deaktiviert werden.