ATR info panel
- Indikatoren
- Version: 4.1
- Aktualisiert: 8 Januar 2024
- Aktivierungen: 10

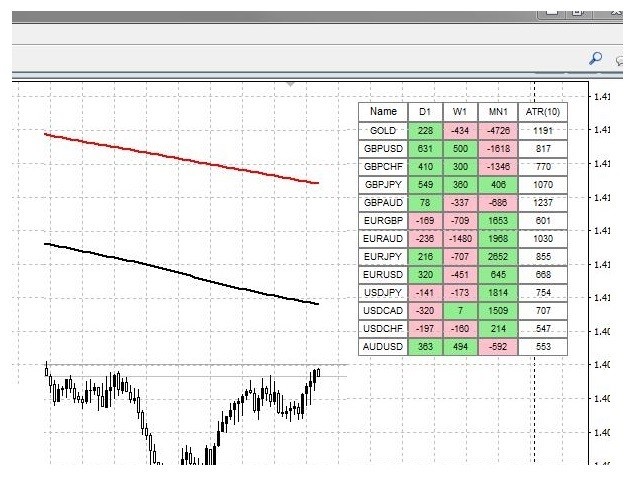
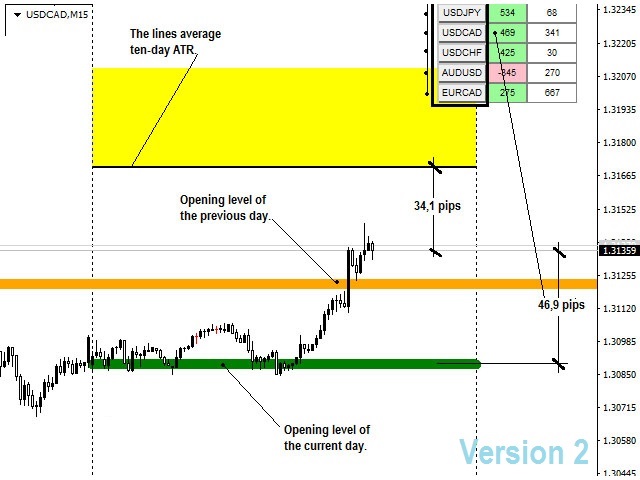
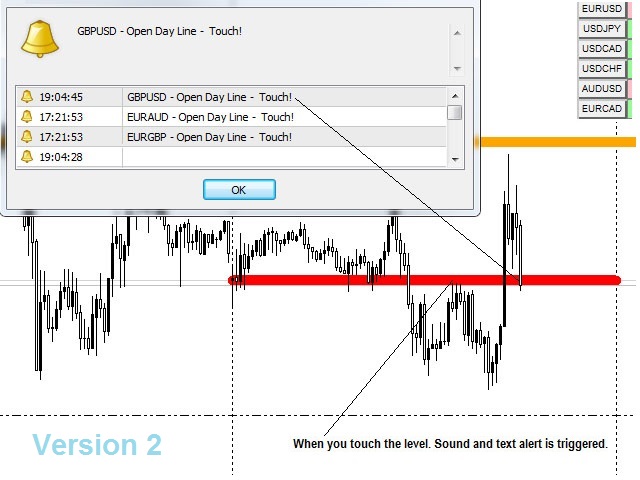
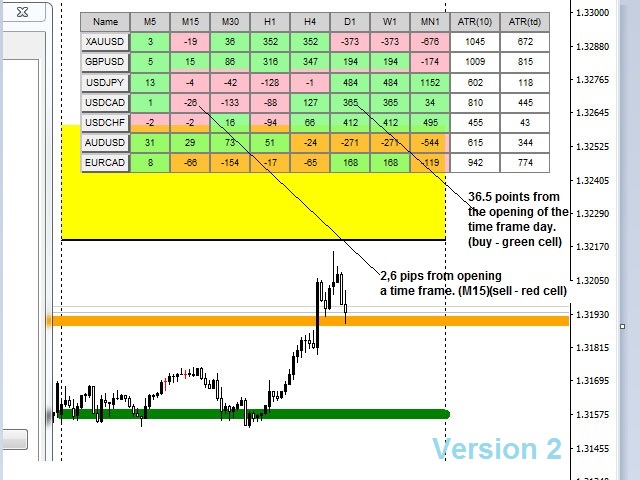
Der Indikator ist eine Tabelle mit den sich ständig ändernden Werten der Punkte, die der Kurs seit Tagesbeginn (D1), seit Wochenbeginn (W1 ) und seit Beginn des laufenden Monats (MN) überschritten hat.
Der Indikator zeigt auch den durchschnittlichen täglichen APR für den ausgewählten Zeitraum an. Die Parameter der gesamten Tabelle sind einstellbar. Verschieben auf den Achsen des Monitors, für die Positionierung an einer geeigneten Stelle, Farben der Texte und Füllung der Zellen, Größen der Spalten, Zeilen, Zahlen und Texte. Sie können es auf weißem und dunklem Hintergrund verwenden.
Anhand des Indikators kann der Händler leicht die Stimmung auf dem Markt und die Richtung der Bewegungen des Währungspaares für bestimmte Zeiträume bestimmen.
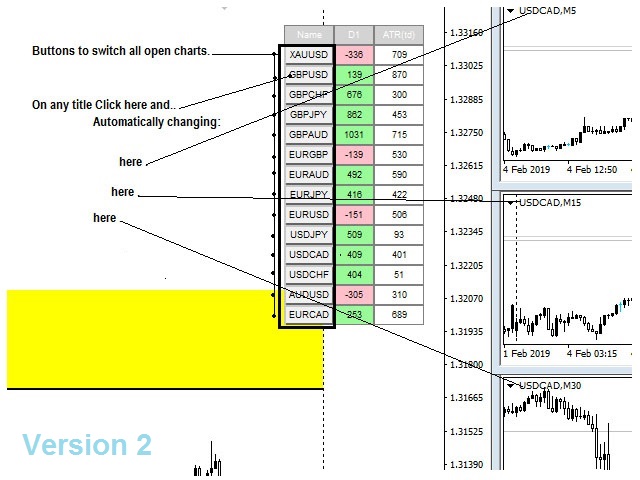
Bis zu fünfzehn Handelsinstrumente können der Tabelle des Indikators in seinen Eingabeparametern hinzugefügt werden.
. Die Namen der ausgewählten Instrumente in der Tabelle sind Schaltflächen zum Umschalten der Charts der Währungspaare (Instrumente).
Einige Parameter des Indikators:
- D1 - Anzeige des Balkens mit den Werten der durchlaufenen Pips vom Beginn des Tages an.
- W1 - Anzeige des Balkens mit den Werten der vergangenen Pips vom Anfang der Woche.
- MN - Anzeige des Balkens der vergangenen Punktwerte vom Anfang des Monats.
- ATR - Anzahl der Tage für die ATR-Berechnung, standardmäßig: 14.
- Sym1 - Symbol des Währungspaares, standardmäßig: GOLD.
- Sym2 - Symbol des Währungspaares, standardmäßig: GBPUSD.
- Sym3 - Symbol des Währungspaares, standardmäßig: GBPCHF.
- Sym4 - Symbol des Währungspaares, standardmäßig: GBPJPY.
- Sym5 - Währungspaarsymbol, standardmäßig: GBPAUD.
- Sym6 - Symbol des Währungspaares, Standardwert: EURGBP.
- Sym7 - Symbol des Währungspaares, Standardwert: EURAUD.
- Sym8 - Währungspaarsymbol, Standardwert: EURJPY.
- Sym9 - Symbol des Währungspaares, Standardwert: EURUSD.
- Sym10 - Symbol des Währungspaares, Standardwert: USDJPY.
- Sym11- Symbol des Währungspaares, Standardwert: USDCAD.
- Sym12 - Symbol des Währungspaares, Standardwert: USDCHF.
- Sym13- Symbol des Währungspaares, Standardwert: AUDUSD.
- Sym14 - Symbol des Währungspaares, Standardwert: -
- Sym15- Währungspaarsymbol, standardmäßig: -
- Rechter Einzug -Tabelleneinzug entlang der X-Achse, Standardwert: 20.
- Einzug von oben - Tabelleneinzug auf der Y-Achse, Voreinstellung: 20.
- Standard-Spaltenbreite: 50,40.
- Höhe der Zeilen und Zellen: 20,20.
Hinweis: Der Indikator ist für den Handel auf M1, M5, M15, M30 sowie für den Handel auf höheren Zeitrahmen geeignet.
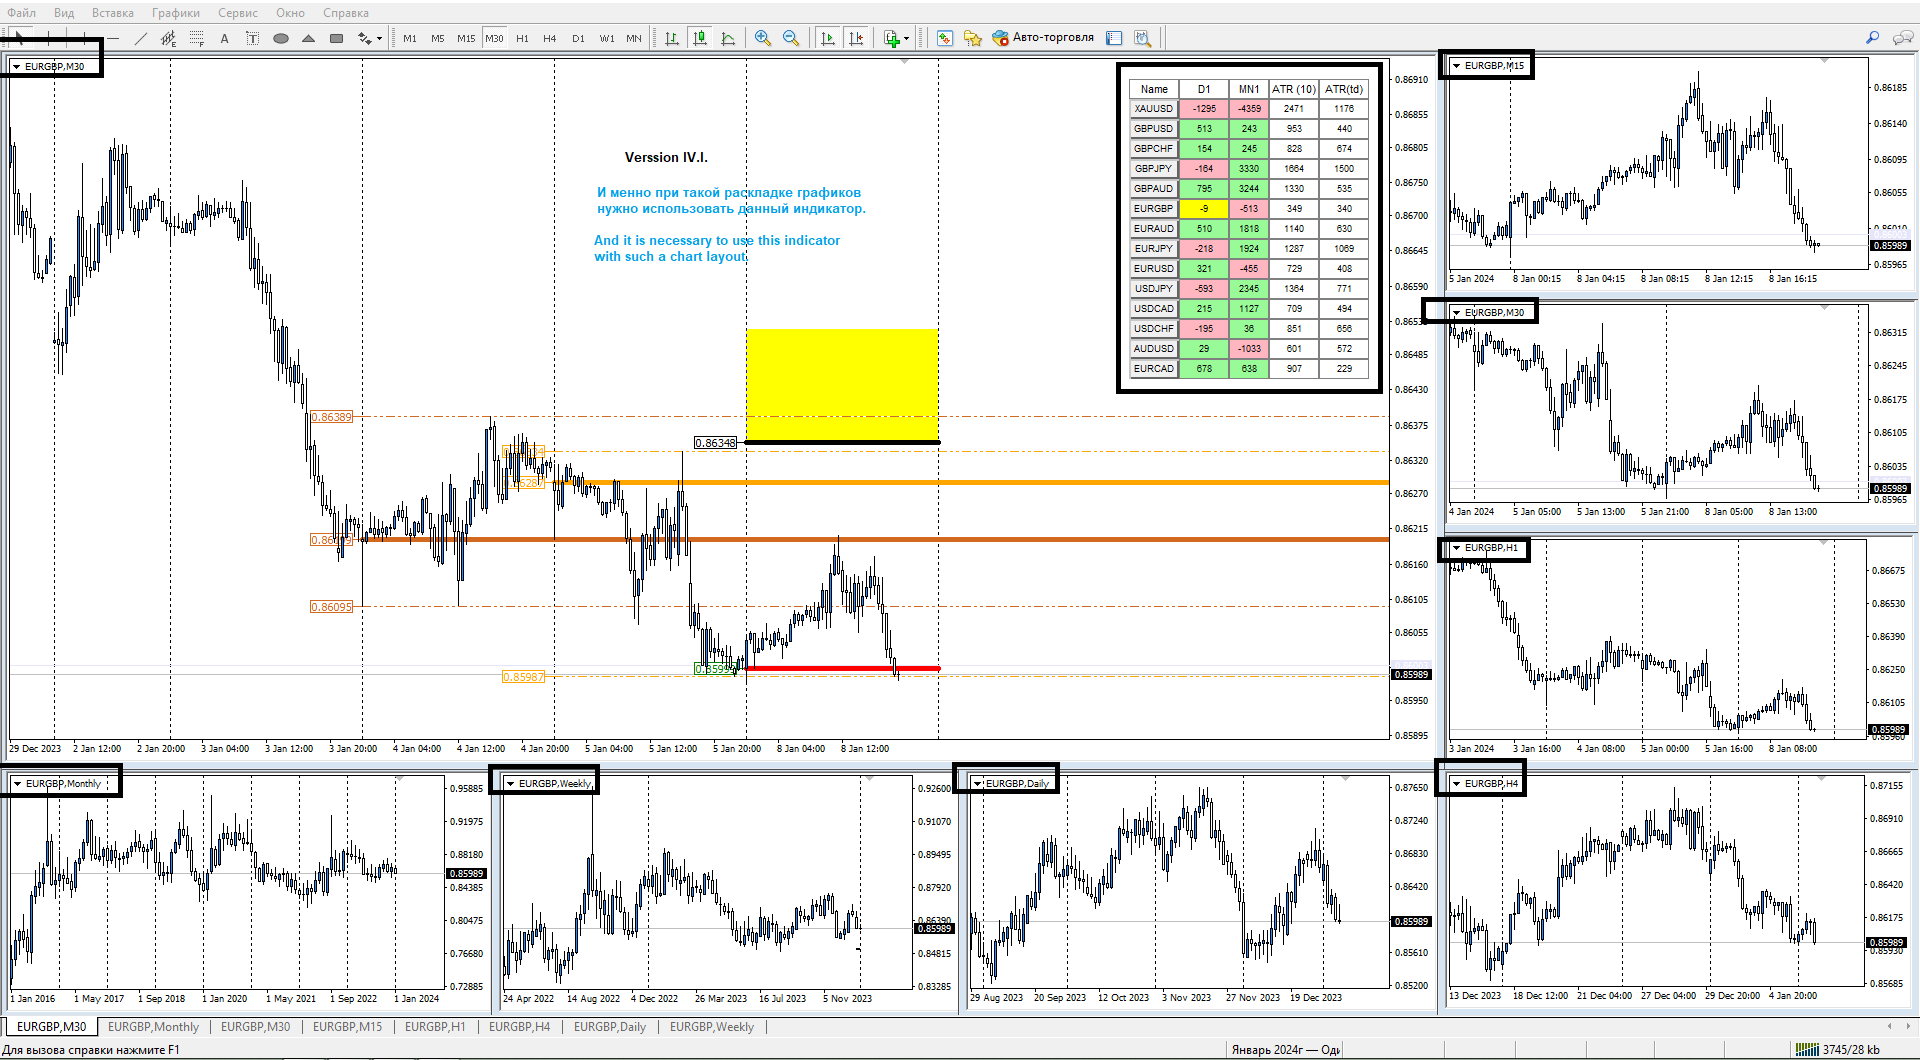
Bei der Arbeit mit dem Indikator wird empfohlen, die Charts aller Zeitrahmen auf einem Monitor einzurichten.
Wenn Sie auf einem Monitor handeln, ist dieser Indikator für Sie geeignet. (siehe den Beschreibungsbildschirm).


пользуюсь несколько месяцев. удобный и простой помощник,можно всё подстроить под себя. самое главное для меня это автоматическая отрисовка ближайших уровней и переключение всех настроенных окон одним кликом! ни разу не пожалел о покупке, Александру огромный респект!!! спасибо!