TDI Signals
- Indikatoren
-
Navdeep Singh
 The momentum of money is always more potent than the gravity of logic
Free or paid, All tools are coded with intention to help traders
My tools:- - Version: 1.1
- Aktualisiert: 12 Februar 2021
- Aktivierungen: 10
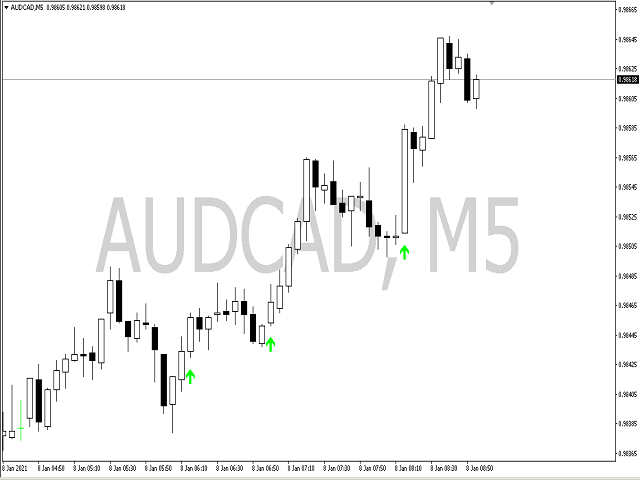
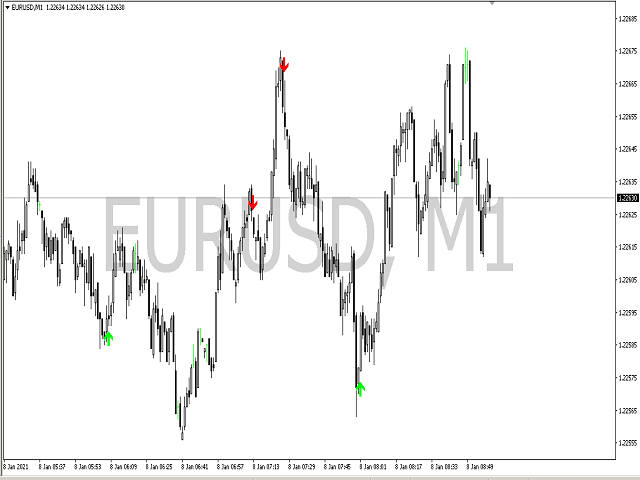
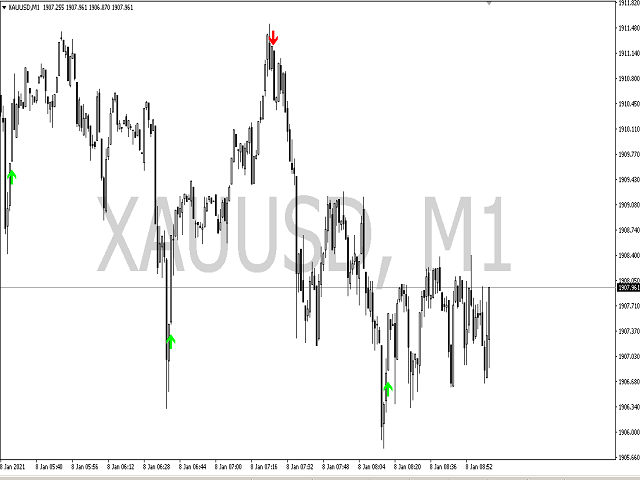
TDI Signals generiert Kauf- und Verkaufspfeile auf der Grundlage eines TDI(Traders Dynamic Index)-Algorithmus. Er sucht nach Kursausbrüchen, Fortsetzungen und Umkehrungen. Standardmäßig läuft es im Trendmodus, aber der Benutzer hat die Möglichkeit, in den Umkehrmodus zu wechseln. Der Händler kann den Modus wählen, der zu seinem Handelsstil passt.
Verwendung:-
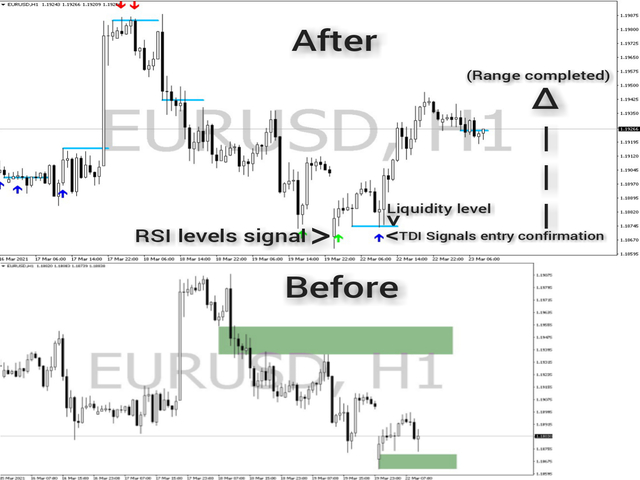
TDI Signals kann als eigenständiger Indikator mit Kontext verwendet werden oder sogar zu Strategien hinzugefügt werden, um Bestätigungen stärker zu machen. Volatilitätsbasierte Stop-Loss, Take-Profit und Positionsgrößen können bei der Verwendung dieses Algorithmus sehr hilfreich sein.
Ein Beispiel für die Verwendung des Indikators in der technischen Analyse ist im folgenden Screenshot zu sehen.