Three line candle scanner with RSI filter
- インディケータ
- バージョン: 1.5
- アップデート済み: 11 2月 2024
- アクティベーション: 10

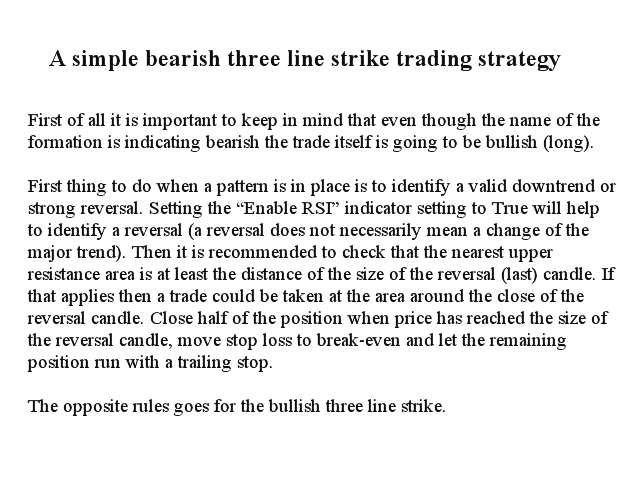
このマルチシンボルおよびマルチタイムフレームインジケーターは、次のローソク足パターンをスキャンします(パターンの説明についてはスクリーンショットを参照してください)。
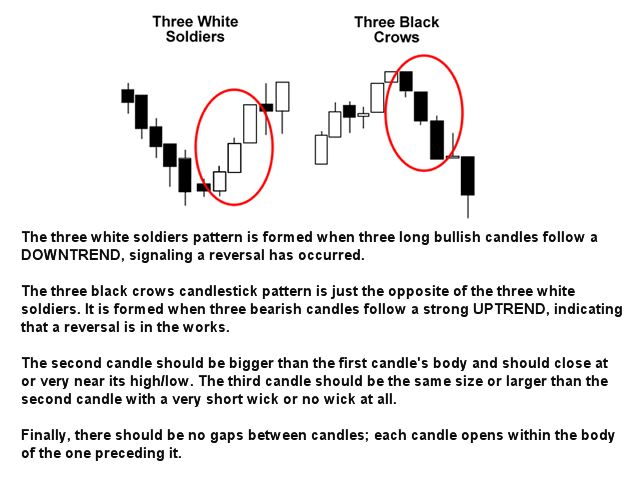
- 3人の白人兵士(逆転>継続パターン)
- 3つの黒いカラス(反転>継続パターン)
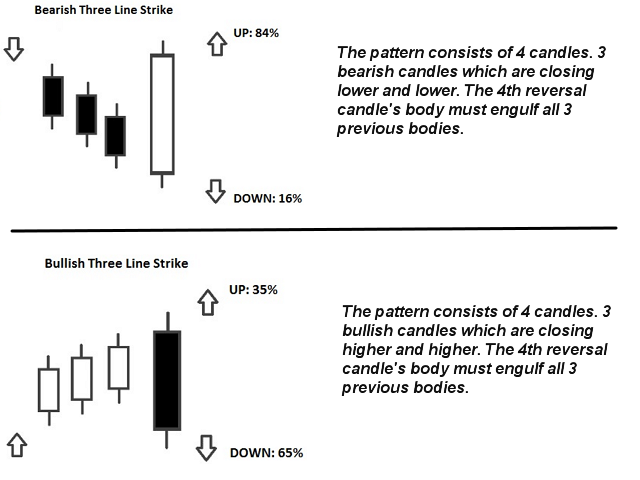
- 強気と弱気のスリーラインストライク(反転パターン)
インジケーター設定の厳密なオプションが有効になっている場合、パターンはより高い時間枠ではあまり頻繁に表示されません。しかし、そうする場合、それは非常に確率の高い設定です。 Thomas Bulkowski(国際的に有名な作家であり、ローソク足パターンの第一人者)によると、3ラインストライクはローソク足パターンの中で最高の全体的なパフォーマンスランクを持っています。このインジケーターを独自のルールや手法と組み合わせると、独自の強力なシステムを作成(または強化)できます。
特徴
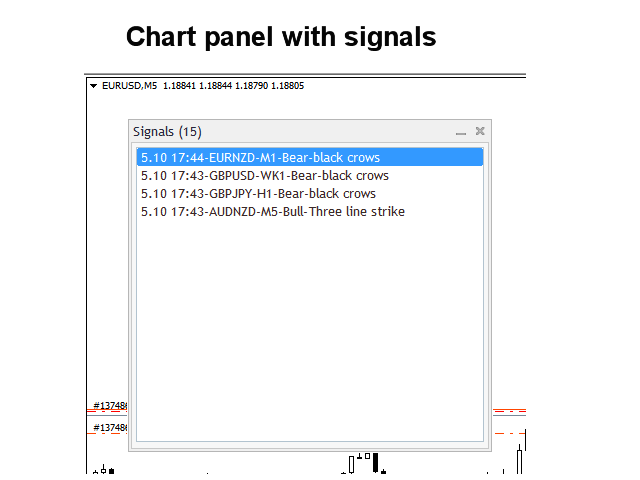
- マーケットウォッチウィンドウに表示されているすべてのシンボルを同時に監視できます。インジケーターを1つのチャートに適用し、市場全体を即座に監視します。
- M1からMNまでのすべての時間枠を監視でき、パターンが識別されたときにリアルタイムのアラートを送信します。すべてのメタトレーダーネイティブアラートタイプがサポートされています。
- 潜在的な反転を適切に識別するために、トレンドフィルターとしてRSIを使用できます。
- インジケータには、インタラクティブパネルが含まれています。アイテムをクリックすると、問題のシンボルと時間枠で新しいチャートが開きます。
入力パラメータ
ここで入力パラメータの説明と説明を見つけてください。
マルチタイムフレーム機能のため、このインジケーターは線や矢印を描画したり、チャートでアドバイスを売買したりしないことに注意してください。
スキャナーに干渉する可能性のある他のインジケーターやエキスパートアドバイザーがいない状態で、インジケーターをクリーンな(空の)チャートに配置することをお勧めします。

ユーザーは評価に対して何もコメントを残しませんでした