Three line candle scanner with RSI filter
- 지표
-
Jan Flodin
 Hello, my name is Jan and I have been developing automated trading tools for the last 9 years. I am originally from Sweden but have lived in the Czech Republic since 2003.
PRODUCTS - 버전: 1.5
- 업데이트됨: 11 2월 2024
- 활성화: 10
이 다중 기호 및 다중 시간 프레임 표시기는 다음 촛대 패턴을 스캔합니다(패턴 설명은 스크린샷 참조).
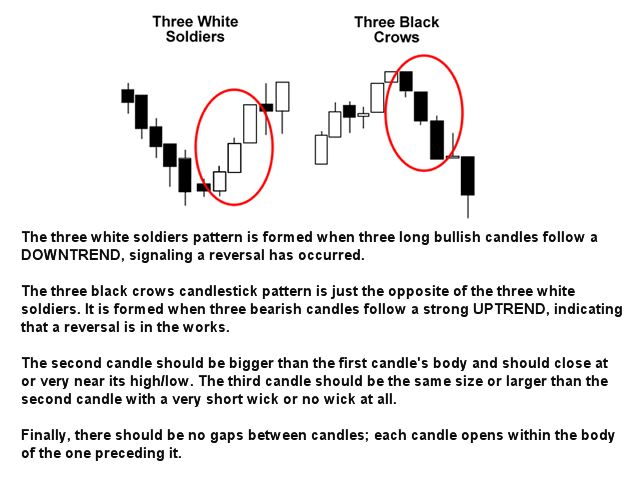
- 백병 3명(역전>연속 패턴)
- 검은 까마귀 3마리(역전>연속 패턴)
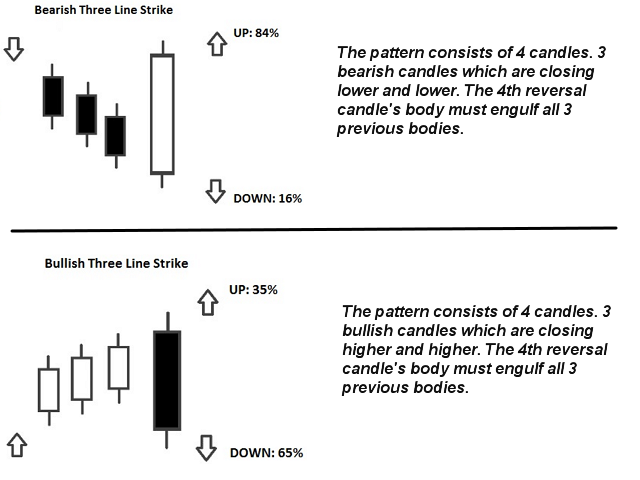
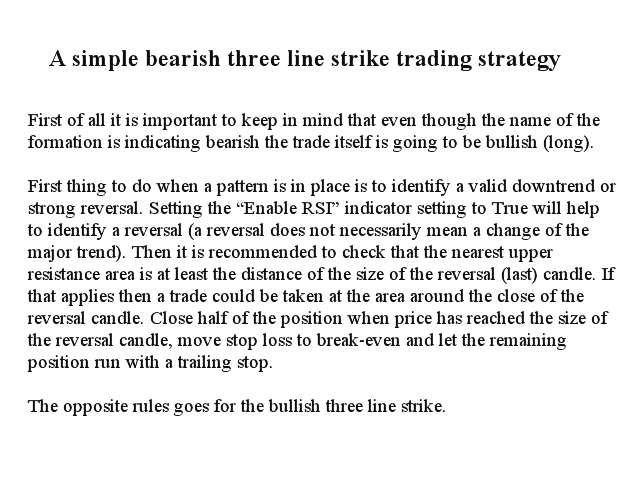
- 강세 및 약세 쓰리 라인 스트라이크(역전 패턴)
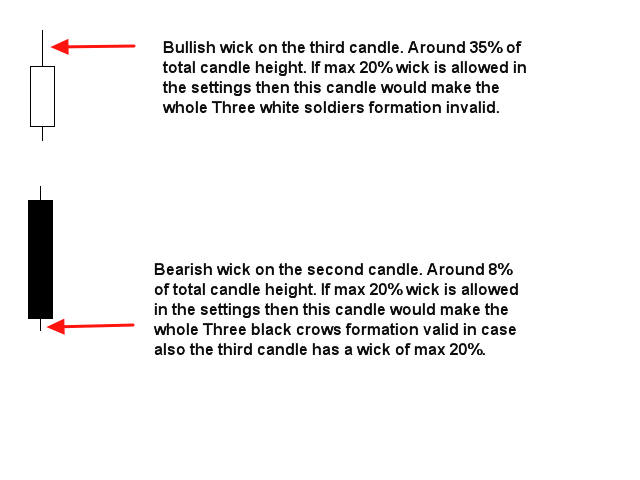
지표 설정의 엄격한 옵션이 활성화된 경우 패턴이 더 높은 기간에 자주 나타나지 않습니다. 그러나 그렇게 할 때 그것은 매우 높은 가능성의 설정입니다. Thomas Bulkowski(국제적으로 알려진 촛대 패턴의 저자이자 선도적인 전문가)에 따르면 Three line strike는 모든 촛대 패턴의 전체 성능 순위가 가장 높습니다. 고유한 규칙 및 기술과 결합하여 이 표시기를 사용하면 강력한 시스템을 생성(또는 강화)할 수 있습니다.
특징
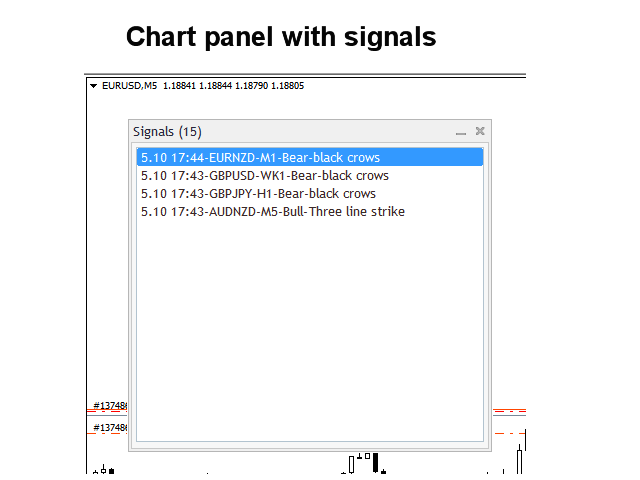
- Market Watch 창에 표시되는 모든 기호를 동시에 모니터링할 수 있습니다. 하나의 차트에만 지표를 적용하고 전체 시장을 즉시 모니터링하십시오.
- M1에서 MN까지 모든 시간 프레임을 모니터링할 수 있으며 패턴이 식별되면 실시간 경고를 보냅니다. 모든 Metatrader 기본 경고 유형이 지원됩니다.
- 잠재적 반전을 적절하게 식별하기 위해 RSI를 추세 필터로 사용할 수 있습니다.
- 표시기는 대화형 패널을 포함합니다. 항목을 클릭하면 해당 기호와 기간이 포함된 새 차트가 열립니다.
입력 매개변수
여기 에서 입력 매개변수에 대한 설명과 설명을 찾으십시오.
다중 시간 프레임 기능으로 인해 이 표시기는 어떤 차트에서도 선과 화살표를 그리거나 판매 및 구매 조언을 하지 않습니다.
스캐너를 방해할 수 있는 다른 지표나 Expert Advisors가 없는 깨끗한(빈) 차트에 지표를 두는 것이 좋습니다.

사용자가 평가에 대한 코멘트를 남기지 않았습니다