Pinbar scanner with trend filter MT5
- Indikatoren
-
Jan Flodin
 Hello, my name is Jan and I have been developing automated trading tools for the last 9 years. I am originally from Sweden but have lived in the Czech Republic since 2003.
PRODUCTS - Version: 1.2
- Aktualisiert: 3 Februar 2025
- Aktivierungen: 10
Dieser Indikator für mehrere Zeitrahmen und Symbole sucht nach Pin Bars. In Kombination mit Ihren eigenen Regeln und Techniken können Sie mit diesem Indikator Ihr eigenes leistungsstarkes System erstellen (oder verbessern).
Merkmale
- Kann alle Symbole, die in Ihrem Market Watch-Fenster sichtbar sind, zur gleichen Zeit überwachen. Wenden Sie den Indikator nur auf einen Chart an und überwachen Sie sofort den gesamten Markt.
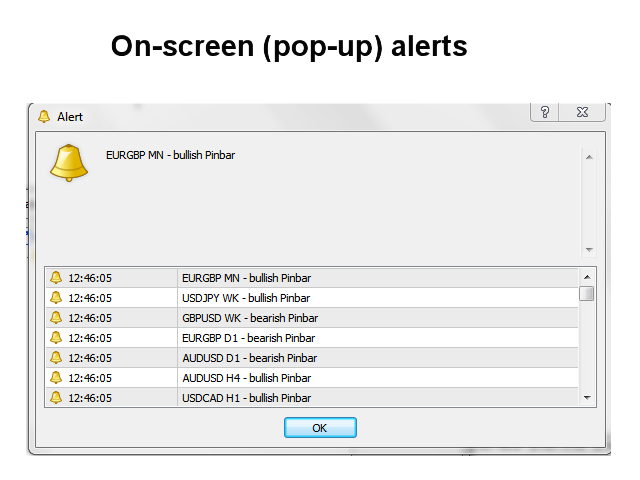
- Kann jeden Zeitrahmen überwachen, von M1 bis MN, und sendet Ihnen einen Echtzeit-Alarm, wenn ein Pin Bar identifiziert wird. Alle nativen Metatrader-Alarmtypen werden unterstützt.
- Kann RSI oder Bollinger-Bänder als Trendfilter verwenden, um potenzielle Umkehrungen richtig zu erkennen.
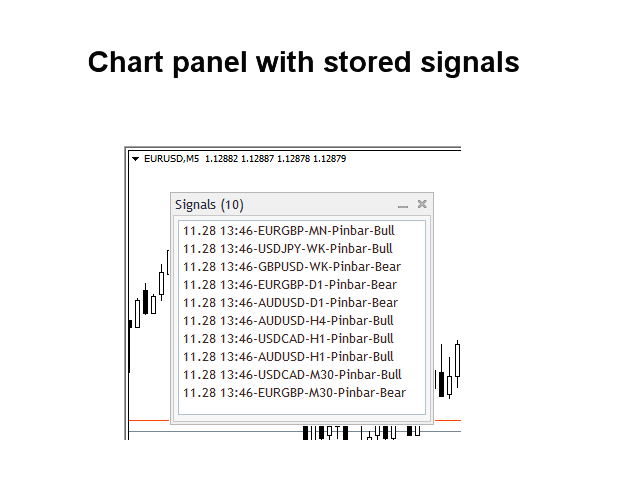
- Der Indikator enthält ein interaktives Panel. Siehe separates Bildschirmfoto.
- Kann so konfiguriert werden, dass Kauf-/Verkaufslinien und TP/SL-Linien (basierend auf dem ATR-Multiplikator) angezeigt werden. Die Linien werden auf dem Chart angezeigt, den Sie durch Klicken auf ein Signal im Panel öffnen. Siehe Bildschirmfoto unten
- Der Indikator kann die Signale (ohne die Handelsempfehlungen) in eine Datei oder als globale Variablen schreiben, die von einem Expert Advisor für den automatischen Handel verwendet werden können.
- Der Indikator kann auch im Einzelchartmodus verwendet werden (er scannt nur den aktuellen Chart).
Eingabeparameter
Die Beschreibung und Erklärung der Eingabeparameter finden Sie hier.
Wichtig
Bitte beachten Sie, dass aufgrund der Multifunktionalität weder Kauf-/Verkaufsempfehlungen noch Linien und Pfeile auf demselben Chart gezeichnet werden, auf dem der Indikator installiert ist. Sie werden auf dem Chart gezeichnet, der geöffnet wird, wenn Sie auf ein Signal im Panel klicken. Es ist sehr ratsam, den Indikator auf einem sauberen (leeren) Chart zu installieren, auf dem sich keine anderen Indikatoren oder Expert Advisors befinden, die den Scanner stören könnten.