Break It Down
- Indikatoren
- Version: 1.1
- Aktualisiert: 21 Juli 2017
- Aktivierungen: 20

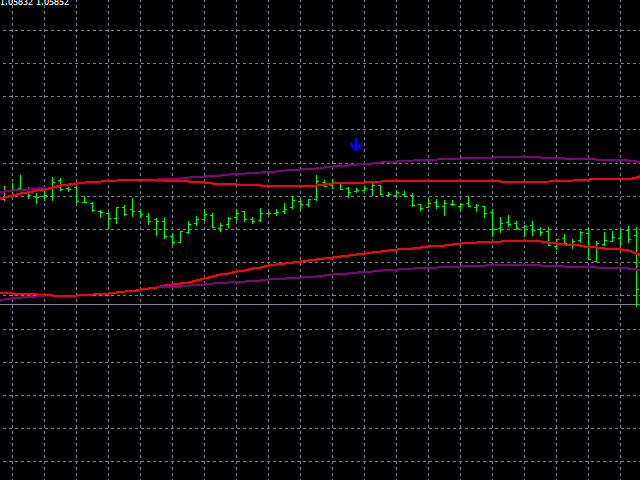
Break It Down basiert auf dem Directional Movement Index und sagt dem Händler, wann ein Markttrend wahrscheinlich sein Maximum erreicht hat und bereit ist, zurückzufallen. Dieses Muster ist besser vorhersehbar, wenn wir dieses System nur anwenden, wenn der Markt sich erholt, aber innerhalb einer Handelsspanne liegt. Da Händler aus Angst verkaufen, bewegt sich der Markt oft schneller, wenn er fällt! Wenn dies geschieht, können gute Bewegungen auftreten.
Da die Händler nicht mehr am Trend interessiert sind, nimmt das Volumen ab und der Kurs fällt in der Regel auf sich selbst zurück. Da Ausverkäufe in der Regel schneller erfolgen als Erholungen, eignet sich dieses System für schnelle Scalping-Ein- und Ausstiegsstrategien.
Wir erkennen, wann ein Trend sein Maximum erreicht hat, indem wir den Average Directional Movement Index und einen Durchschnitt des Volumens verwenden. Wir erkennen, dass sich der Markt in einer Handelsspanne befindet, indem wir größere Bollinger-Bänder und Keltner-Bänder verwenden (es wird empfohlen, beide 5-mal größer als der reguläre 20-Perioden-Durchschnitt zu wählen) und feststellen, wann die oberen und unteren Bollinger-Linien in die Keltner-Linien fallen, um zu erkennen, wann sich der Markt in einer engen Spanne befindet. Wenn sich der Markt in dieser engen Spanne befindet, ist es wahrscheinlicher, dass das Break-It-Down-Muster auftritt und somit ein Signal angezeigt wird.
- Eine intelligente Methode, um zu erkennen, wann ein Aufwärtstrend entweder zurückgeht oder sich vollständig umkehrt.
- Legen Sie die Zahl fest, für die die Liniendifferenz am wahrscheinlichsten eine Handelsspanne vorhersagt.
- Wählen Sie Ihre bevorzugten Signal- und Bollinger-Linien-Farben.
- Senden Sie Warnungen entweder an Ihren PC, per E-Mail oder an ein mobiles Gerät.
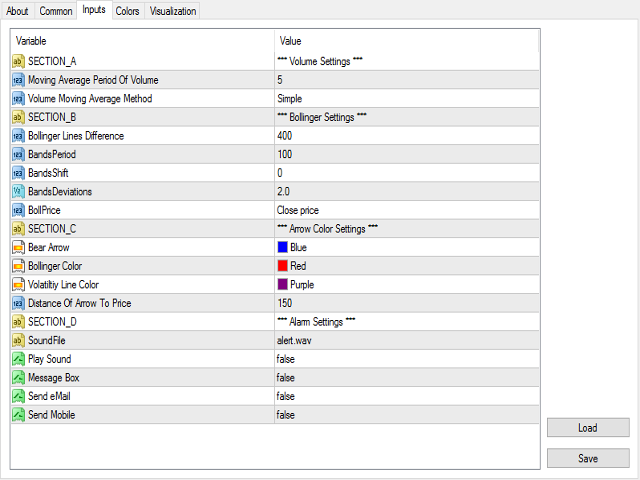
Einstellungen :
Bollinger Band Einstellungen
- Bands_Period - legen Sie die Periode des gleitenden Durchschnitts der Bollinger-Bänder fest (WICHTIGER HINWEIS! Es wird empfohlen, den Wert 100 zu wählen, der 5x größer ist als der übliche Wert 20)
- Bands_Shift - legt fest, um welchen Balken der aktuelle Balken zurückversetzt wird, auf dem die Berechnung basiert. EG 0 = aktueller Balken, 1 = vorheriger Balken vom aktuellen
- Bands_Deviation - legt die Berechnung der Standardabweichung fest.
- Bands_Price - legt die Art des Preises fest, auf dem die Berechnung basiert: PRICE_CLOSE, PRICE_OPEN, PRICE_HIGH, PRICE_LOW, PRICE_MEDIAN, PRICE_TYPICAL, PRICE_WEIGHTED
Keltner-Einstellungen
- Keltner Periode - legen Sie die Periode des gleitenden Durchschnitts fest, auf dem unser Keltner-Kanal basiert (WICHTIGER HINWEIS! Es wird empfohlen, den Wert 100 zu belassen, der 5x größer ist als der übliche Wert 20)
- Keltner ATR - legt die Average True Range fest (WICHTIGER HINWEIS! Es wird empfohlen, diese auf 5,0 statt der üblichen 1,5 zu belassen)
- Keltner Moving Average Mode - legt die Art des gleitenden Durchschnitts fest, den wir verwenden. EG 0 = Einfach, 1 = Exponential, 2 = Geglättet und 3 = Linear gewichtet
Grafische Objekteinstellungen
- Bear Arrow Color - legt die Farbe des Bärenpfeils fest
- Bollinger-Farbe - legt die Farbe der Bollinger-Bänder-Linie fest
- Farbe der Volatilitätslinie - legen Sie die Farbe der Linie fest, die wir aus unserer beschlossenen Liniendifferenz erstellen
Alert-Einstellungen
- Soundfile - welche Wave-Datei wir für unseren PC-Alarm verwenden
- PlaySound - true bedeutet, dass wir unseren PC-Alarm hören, false bedeutet, dass wir unseren PC-Alarm nicht hören
- MessageBox - true bedeutet, dass wir eine Messagebox sehen, false bedeutet, dass wir keine Messagebox sehen
- SendeMail - true bedeutet, dass wir einen Alarm an unsere E-Mail erhalten, false bedeutet, dass wir keinen Alarm an unsere E-Mail erhalten
- SendMobile - true bedeutet, dass wir einen Alarm an unser Mobilgerät gesendet bekommen, false bedeutet, dass wir keinen Alarm an unser Mobilgerät gesendet bekommen

Der Benutzer hat keinen Kommentar hinterlassen