Bollinger Breakout Trader
- Indikatoren
- Version: 1.1
- Aktualisiert: 21 Juli 2017
- Aktivierungen: 20

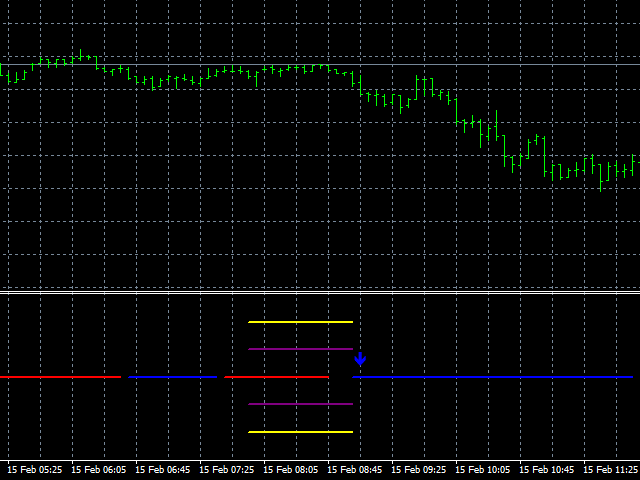
Der Bollinger Breakout Trader zeigt dem Händler an, wenn der Markt kurz vor einem Ausbruch aus einer nicht volatilen Phase steht.
Nicht-Volatilität bedeutet in der Regel, dass der Markt Dampf für weitere gute Bewegungen in der Zukunft aufbaut. Ein Signal wird gebildet, wenn dieser Wechsel von nicht volatil zu volatil erfolgt.
Diese Perioden werden sowohl durch Bollinger Bänder als auch durch Keltner-Kanäle gemessen. Bollinger Bänder messen die Standardabweichung des Preises vom gleitenden Durchschnitt, was zu einem sich ausweitenden und zusammenziehenden Kanal führt. Keltner-Kanäle basieren auf dem gleitenden Durchschnitt und der durchschnittlichen wahren Spanne des gleitenden Durchschnitts. Daraus ergibt sich ein gleichmäßigerer Bereich. Wenn die Bollinger Bänder innerhalb dieser Keltner-Kanäle eintauchen, gilt der Markt als nicht volatil. Wenn sich die Bollinger Bänder außerhalb dieser Bänder bewegen, kommt es normalerweise zu volatilen Perioden mit guten Bewegungen.
Um zu entscheiden, in welche Richtung gehandelt werden soll, verwenden wir das Momentum, um festzustellen, welche Richtung am stärksten ist und sich am wahrscheinlichsten fortsetzen wird.
Merkmale:
- Eine praktische Methode, um zu erkennen, wann sich ein neuer Trend anbahnt.
- Legen Sie fest, wann der Höchststand einer Sitzung erreicht werden soll und wann die Zählung zurückgesetzt werden soll.
- Wählen Sie Ihre bevorzugte Signalfarbe.
- Senden Sie Warnungen entweder an Ihren PC, per E-Mail oder an ein mobiles Gerät.
- Funktioniert in jedem Zeitrahmen.
Einstellungen :
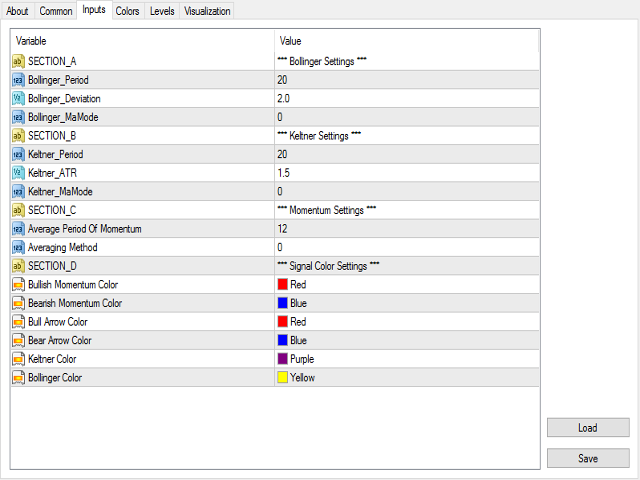
Bollinger Einstellungen
- Bollinger_Periode - Legt die Periode des gleitenden Durchschnitts der Bollinger-Bänder fest.
- Bollinger_Deviation - Legt die Berechnung der Standardabweichung fest.
- Bollinger_MaPeriod - Legt die Art des Durchschnitts fest, auf dem die Berechnung basiert: 0 = einfache Mittelwertbildung, 1 = exponentielle Mittelwertbildung, 2 = geglättete Mittelwertbildung, 3 = linear gewichtete Mittelwertbildung
Keltner-Einstellungen
- Keltner_Period - Die Periode, auf die wir unseren Keltner-Kanal einstellen.
- Keltner_ATR - Der durchschnittliche wahre Bereich, auf den der Keltner-Kanal eingestellt ist.
- Keltner_MaMode - Legt die Art des Durchschnitts fest, auf dem unsere Berechnung basiert: 0 = Einfache Mittelwertbildung, 1 = Exponentielle Mittelwertbildung, 2 = Geglättete Mittelwertbildung, 3 = Linear gewichtete Mittelwertbildung
Momentum-Einstellungen
- Durchschnittsperiode des Momentums - Legt die Periode fest, auf der unser Momentum basiert.
- Mittelungsmethode - Legt die Art der Mittelwertbildung fest, auf der die Berechnung basiert: 0 = Einfache Mittelwertbildung, 1 = Exponentielle Mittelwertbildung, 2 = Geglättete Mittelwertbildung, 3 = Linear gewichtete Mittelwertbildung
Einstellungen der Signalfarbe
- Bullish Momentum Color - Wählen Sie die gewünschte Farbe für das bullische Momentum-Signal.
- Bearish Momentum Color - Wählen Sie die gewünschte Farbe für das bearishe Momentum-Signal.
- Farbe des Kaufpfeils - Legt die Farbe des Kaufpfeils fest.
- Farbe des Verkaufspfeils - Legt die Farbe des Verkaufspfeils fest.
- Keltner-Farbe - Legt die Farbe des Keltner-Kanals fest.
- Bollinger Farbe - Legt die Farbe des Bollinger Bandes fest.
Der Benutzer hat keinen Kommentar hinterlassen